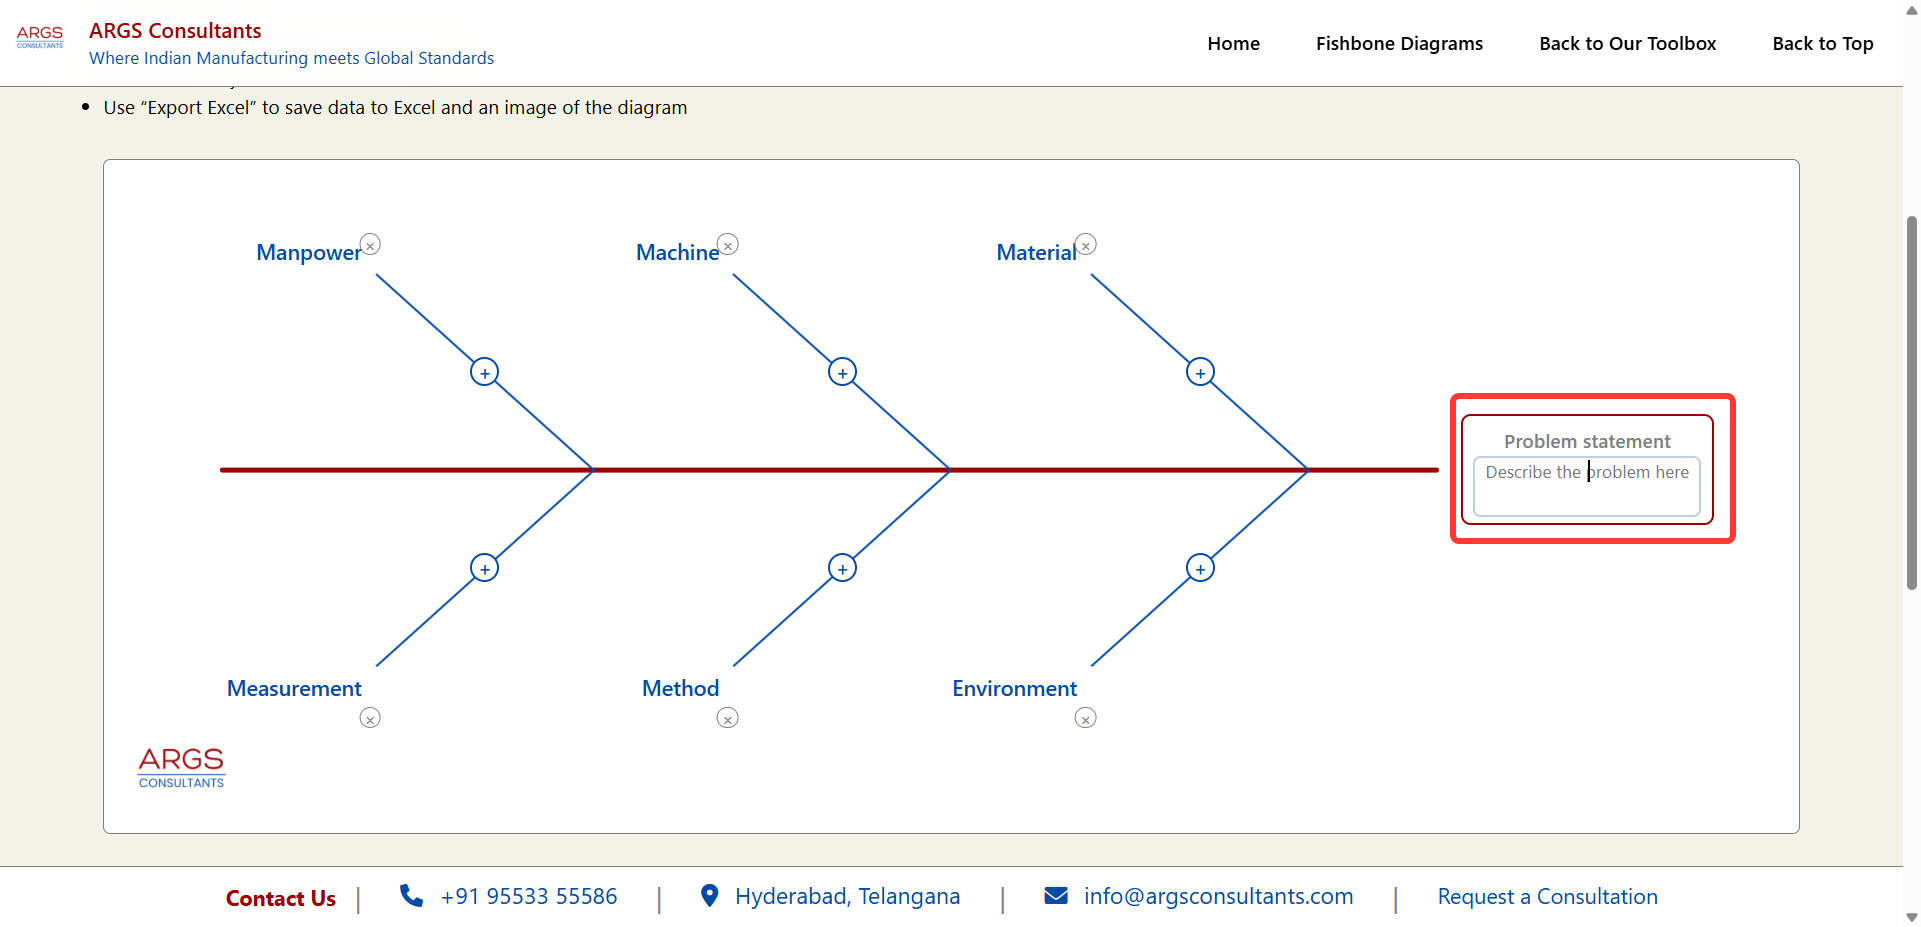
Start by adding "Problem statement"
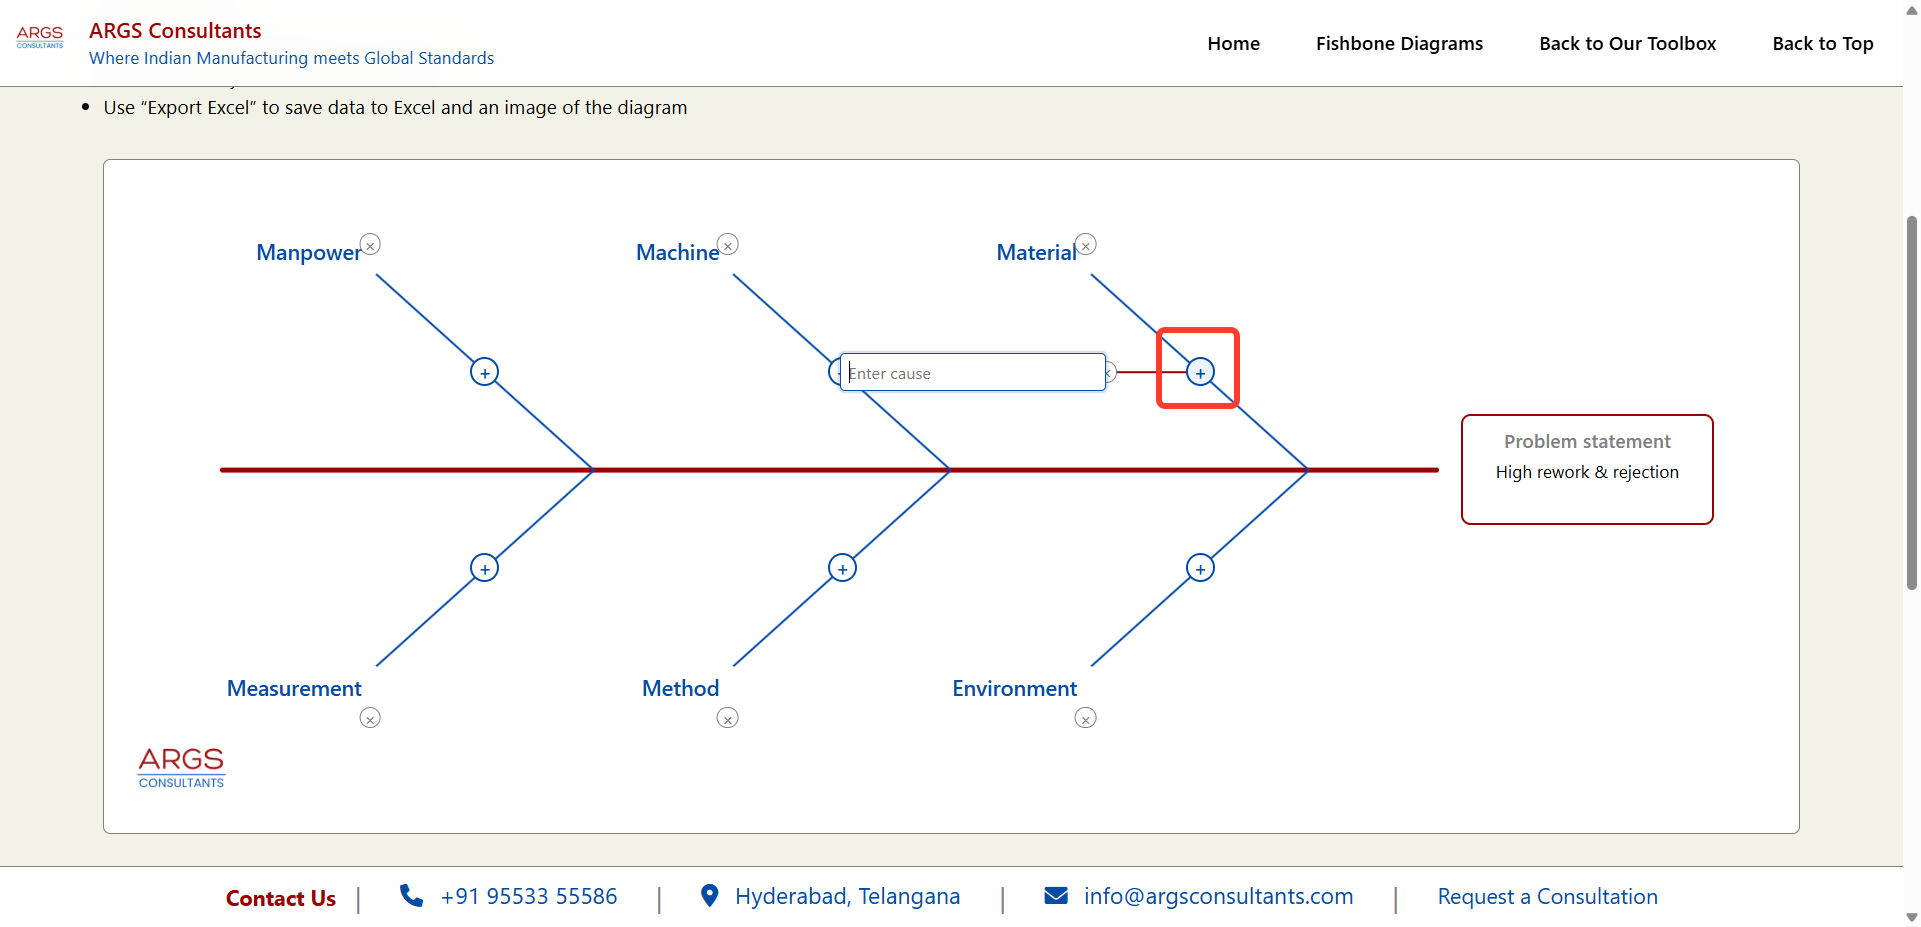
Click "Add a cause" under "Material" and give a brief description
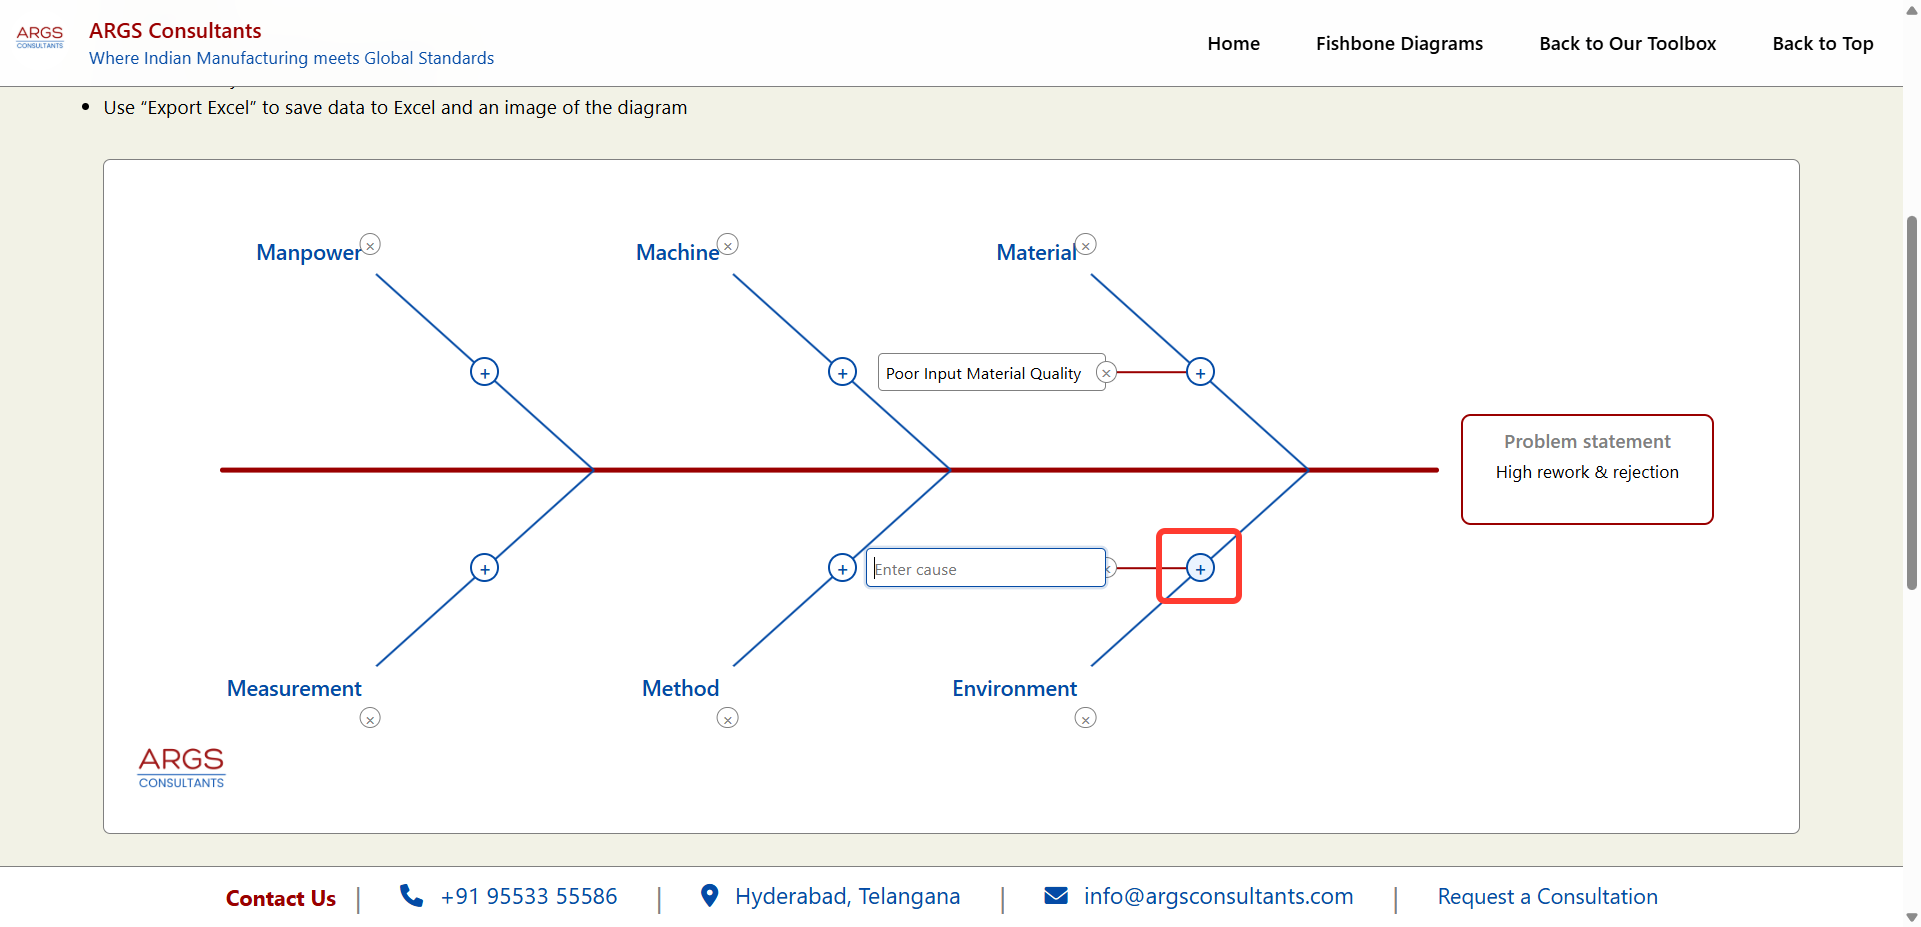
Click "Add a cause" under "Environment" and give a brief description
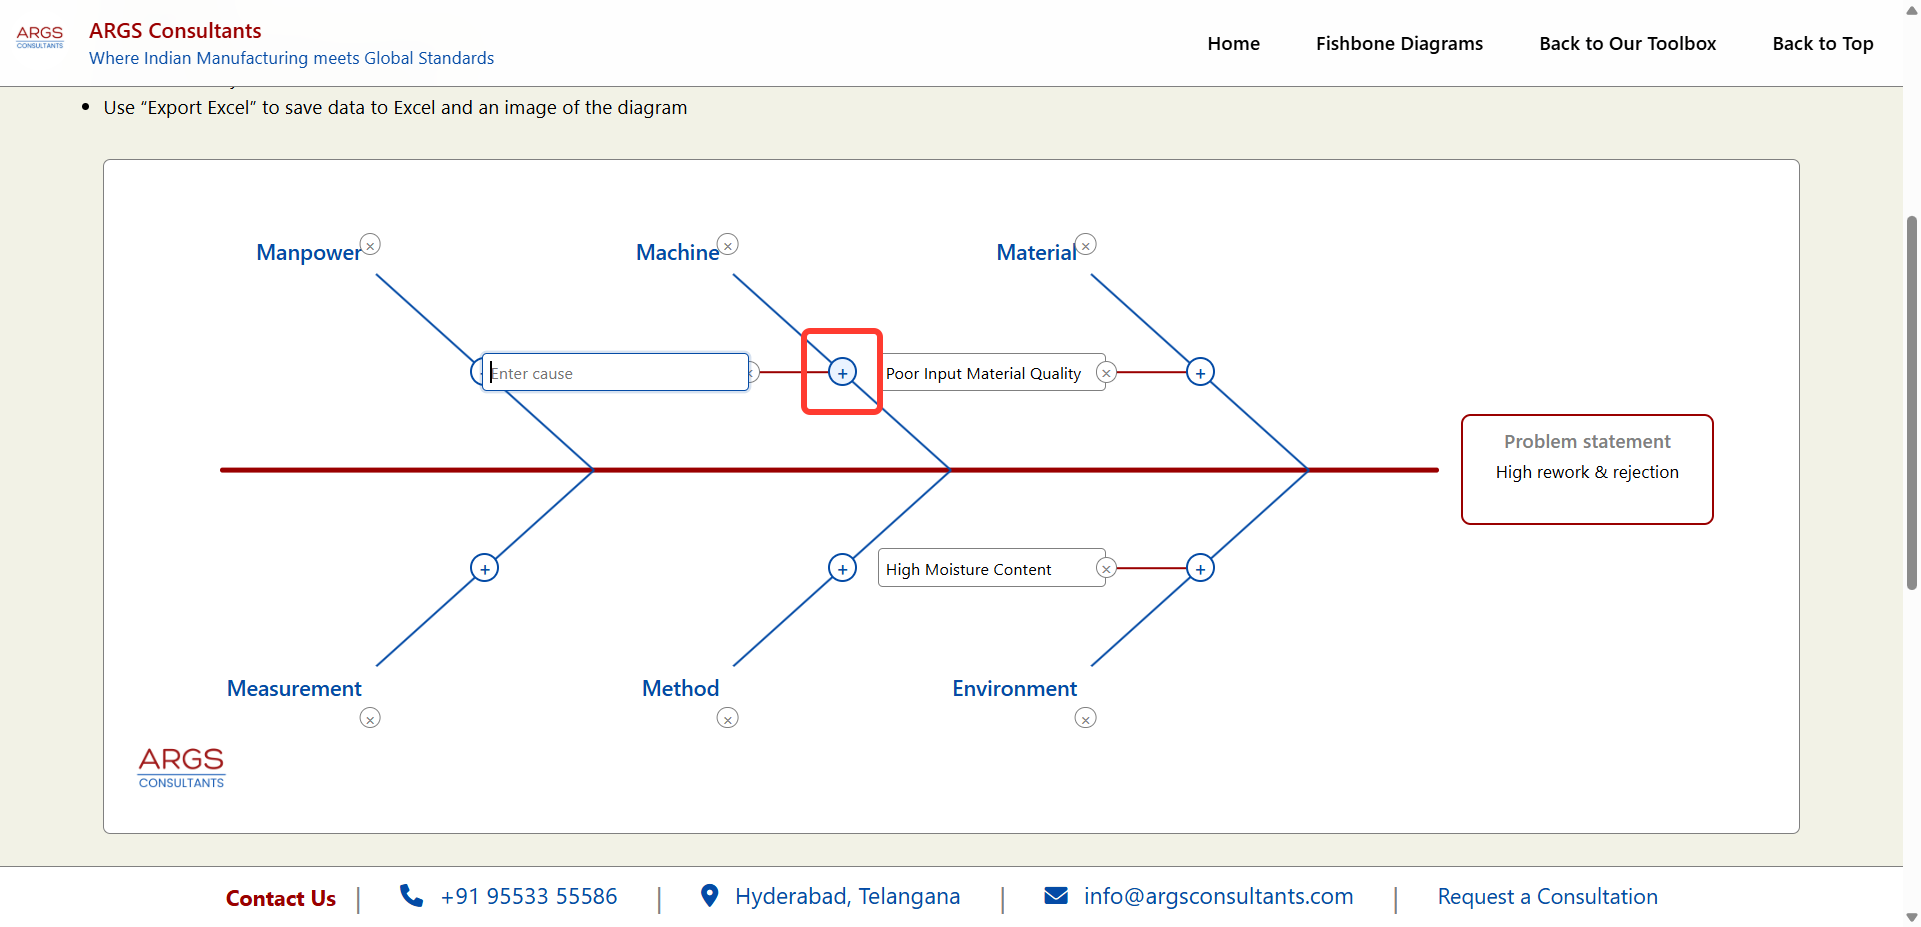
Click "Add a cause" under "Machine" and give a brief description
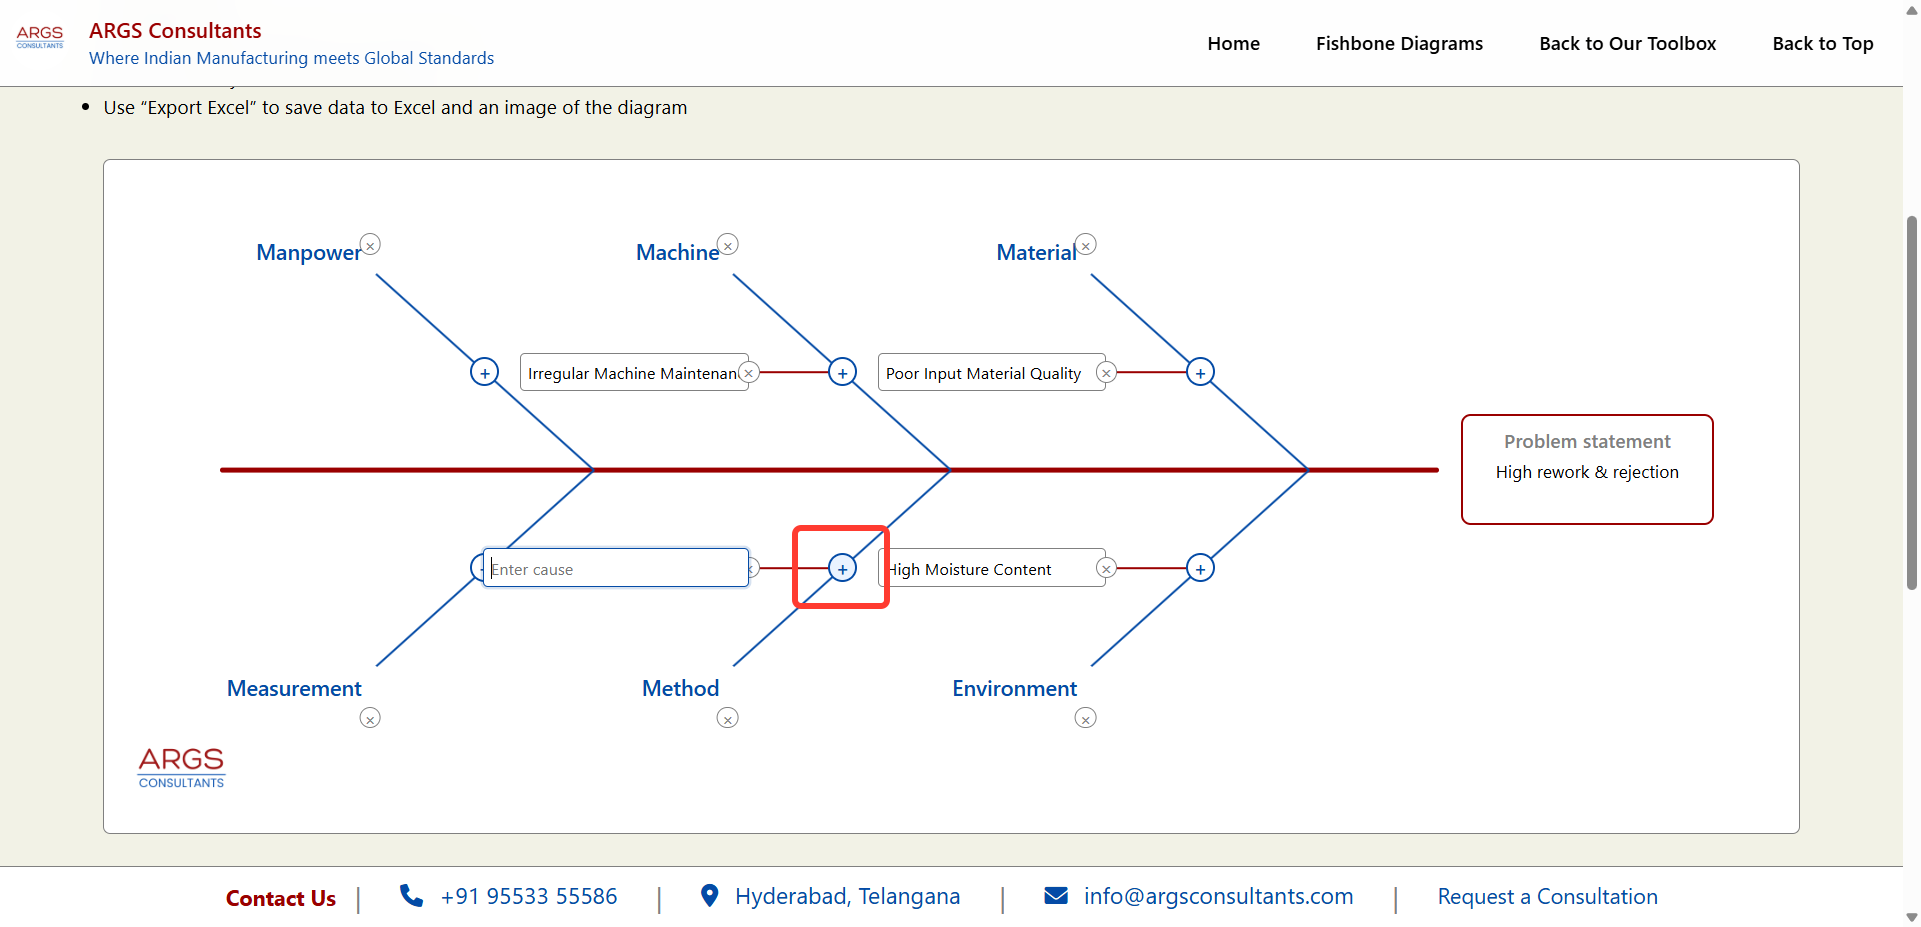
Click "Add a cause" under "Method" and give a brief description
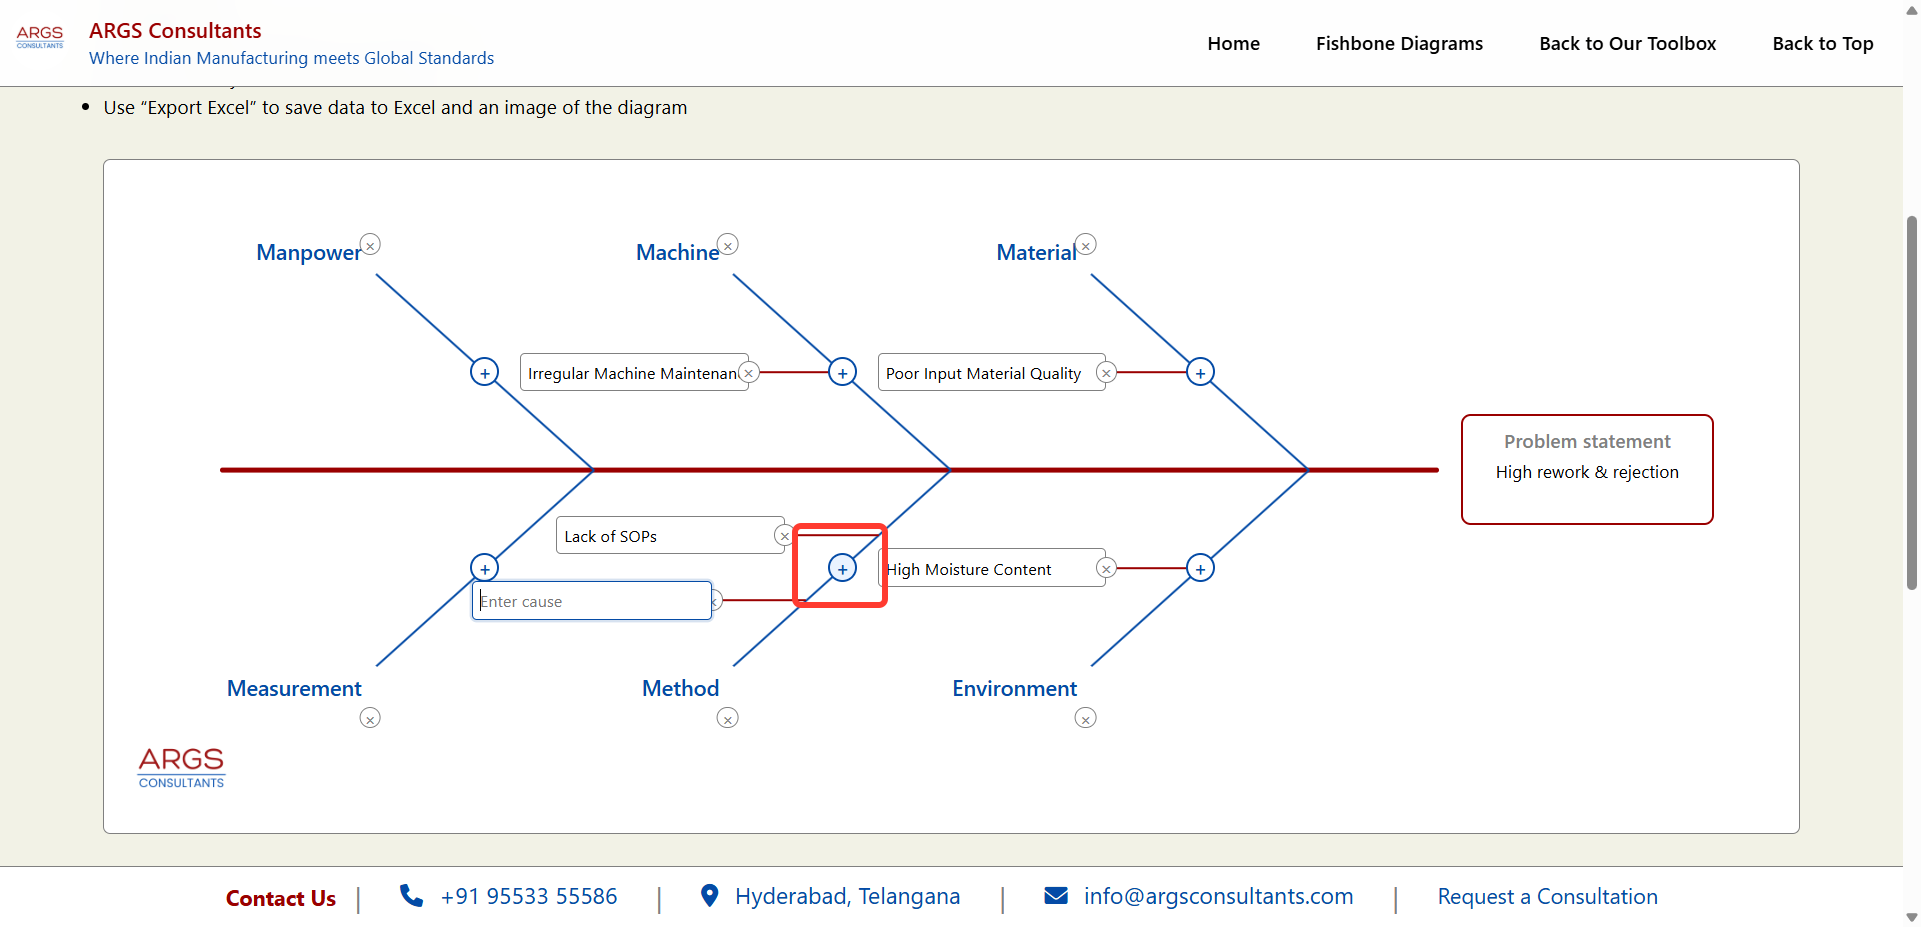
You can add multiple causes for the same branch, in this case "Method" and give a brief description
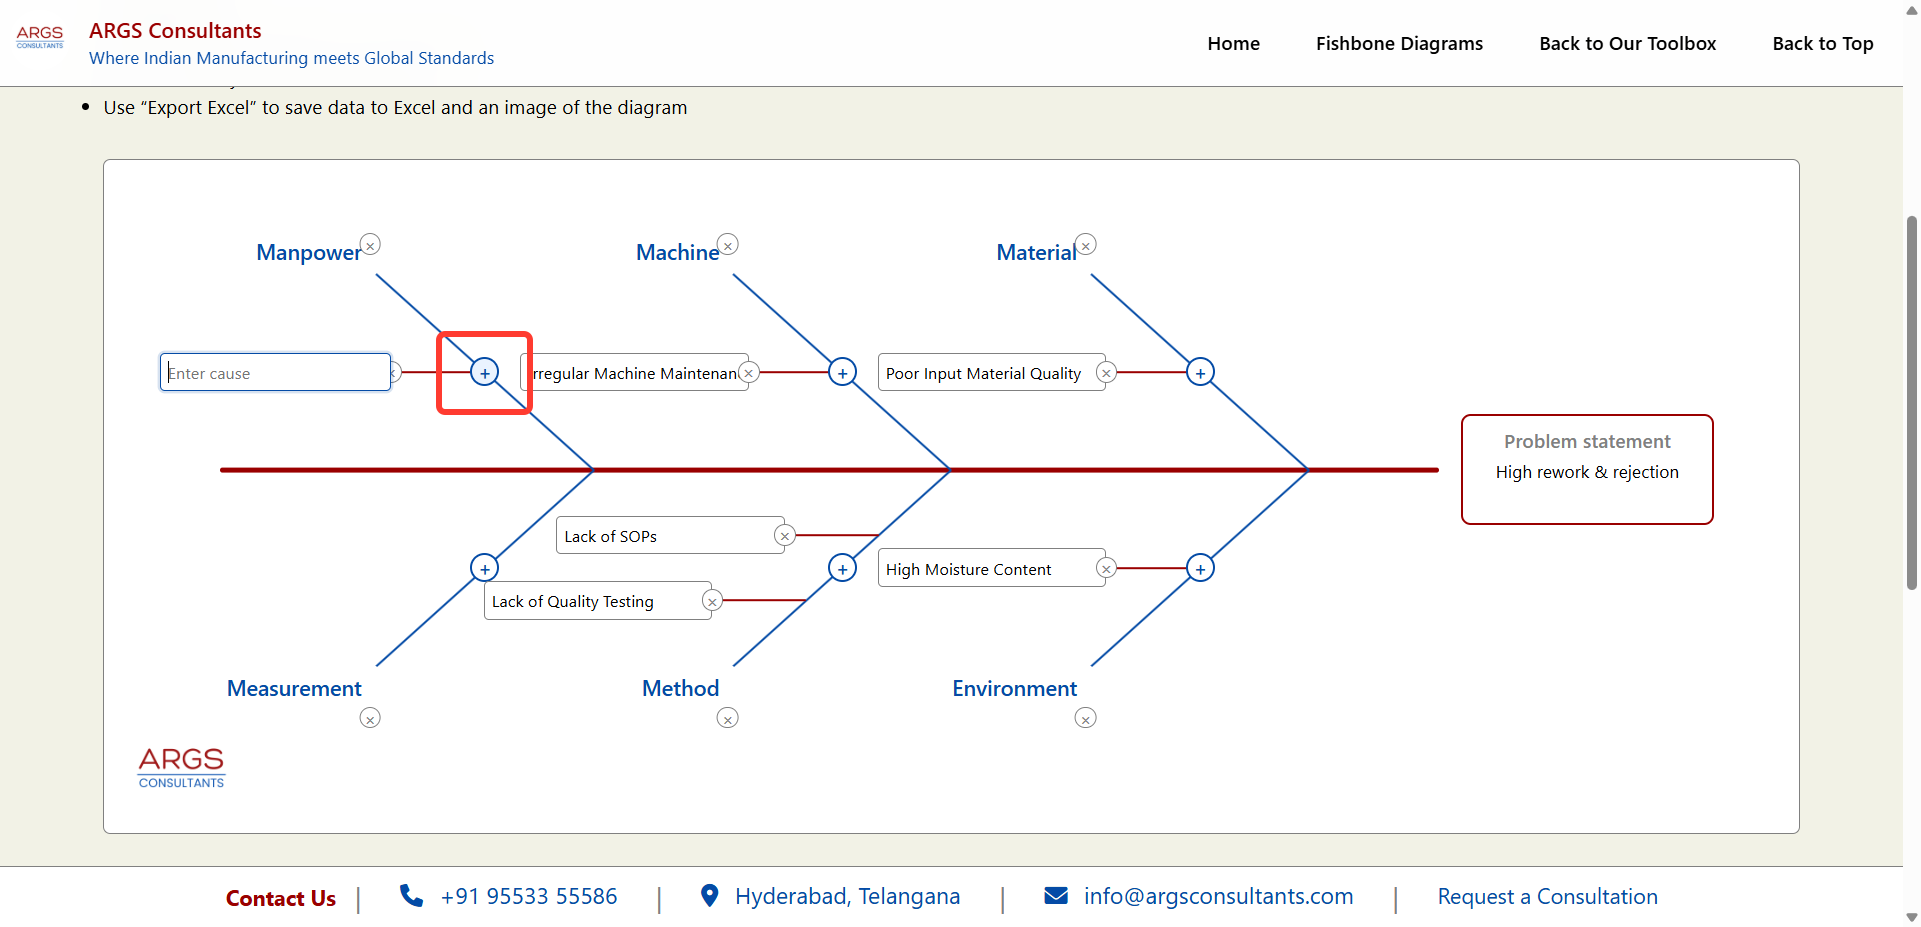
Click "Add a cause" under "Manpower" and give a brief description
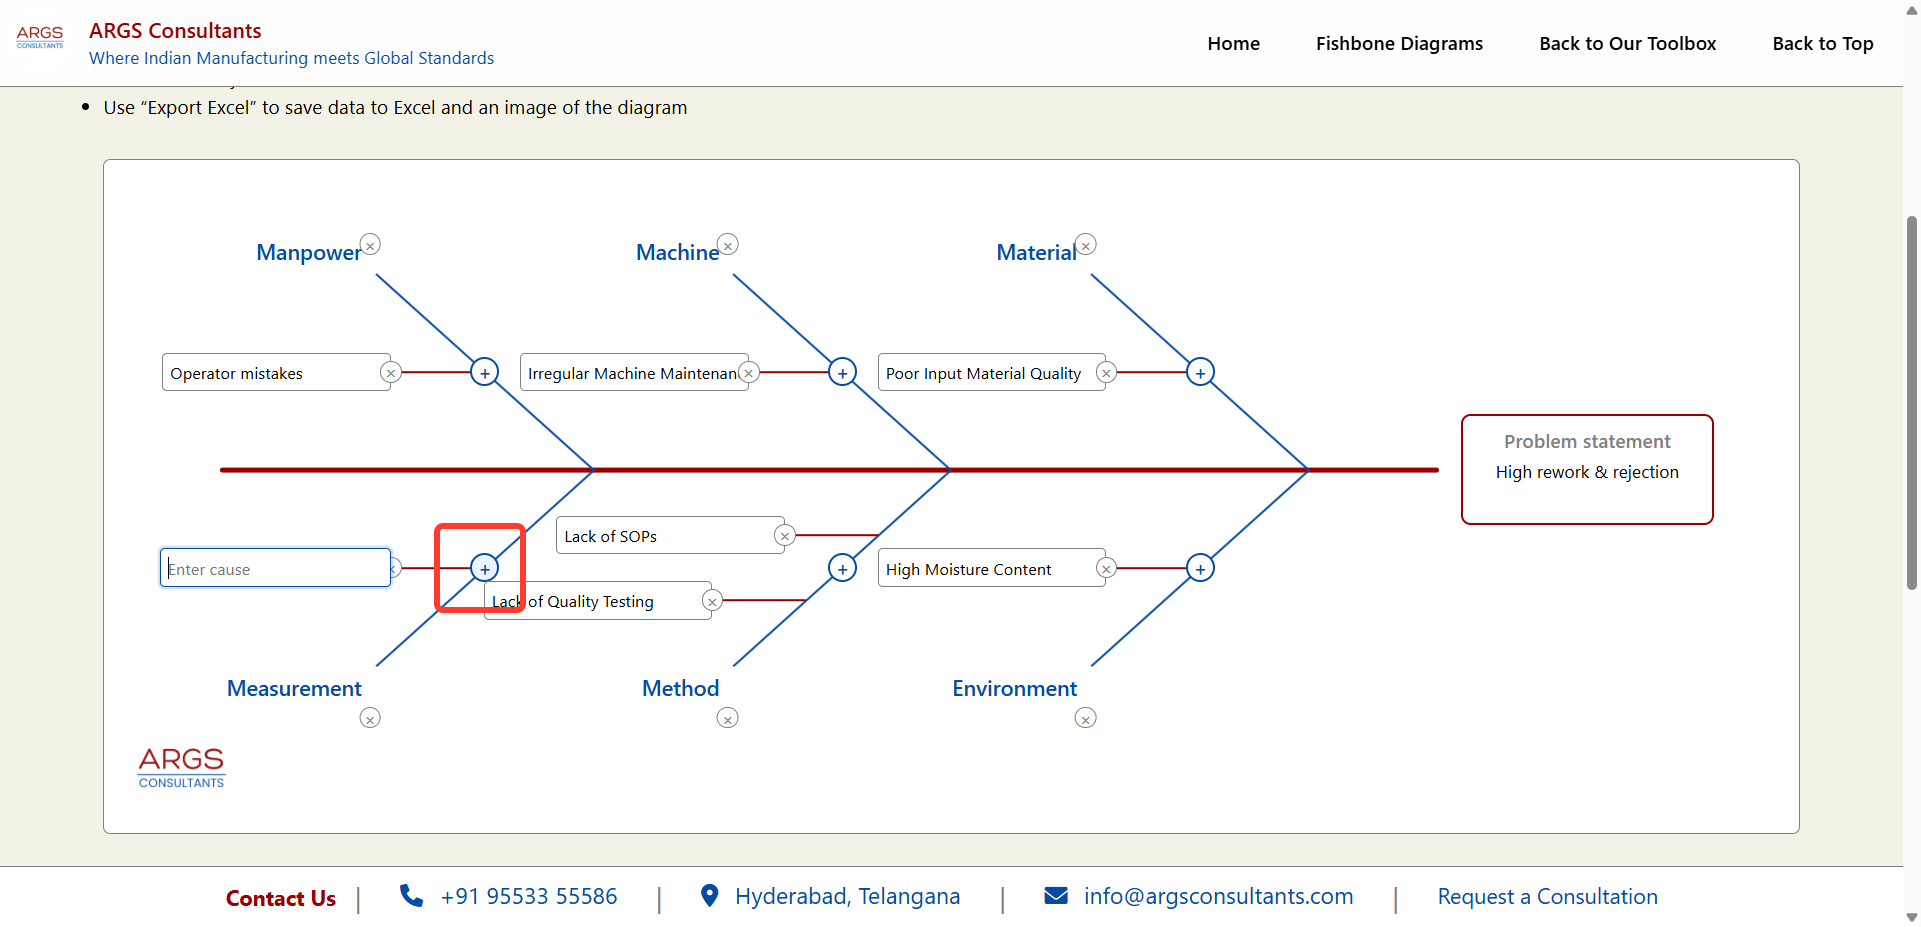
Click "Add a cause" under "Measurement" and give a brief description
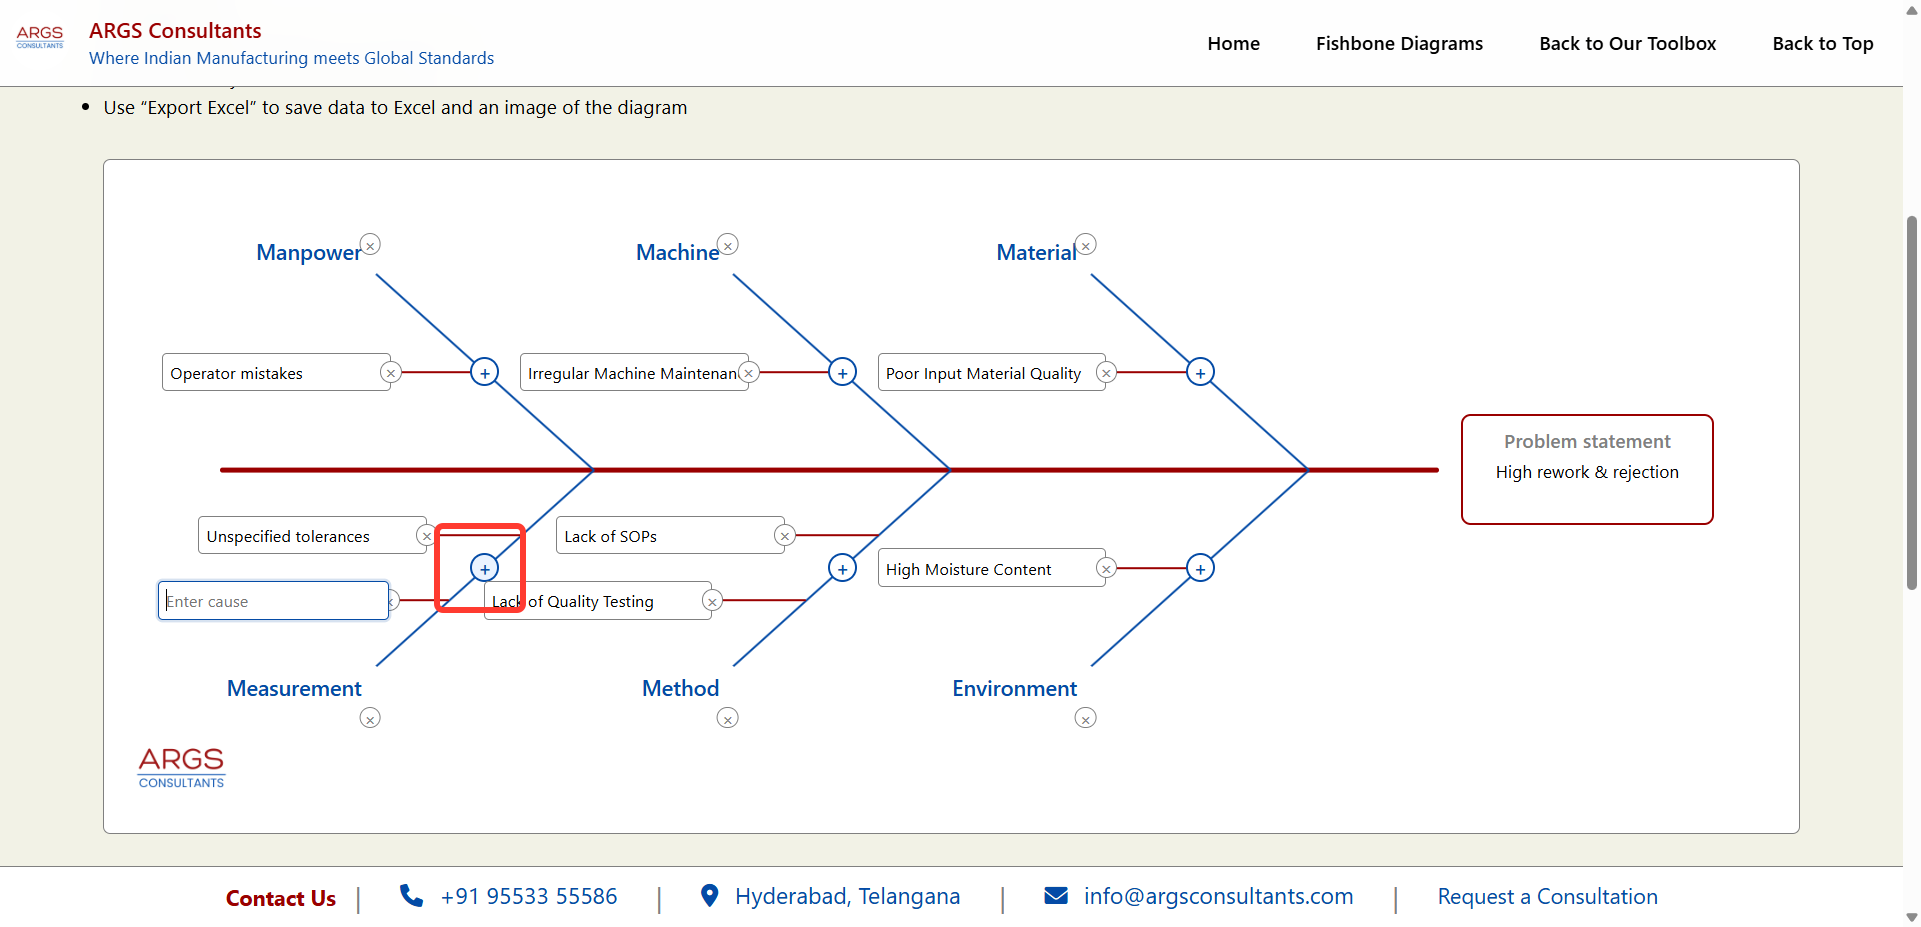
You can add multiple causes for the same branch, in this case "Measurement" and give a brief description
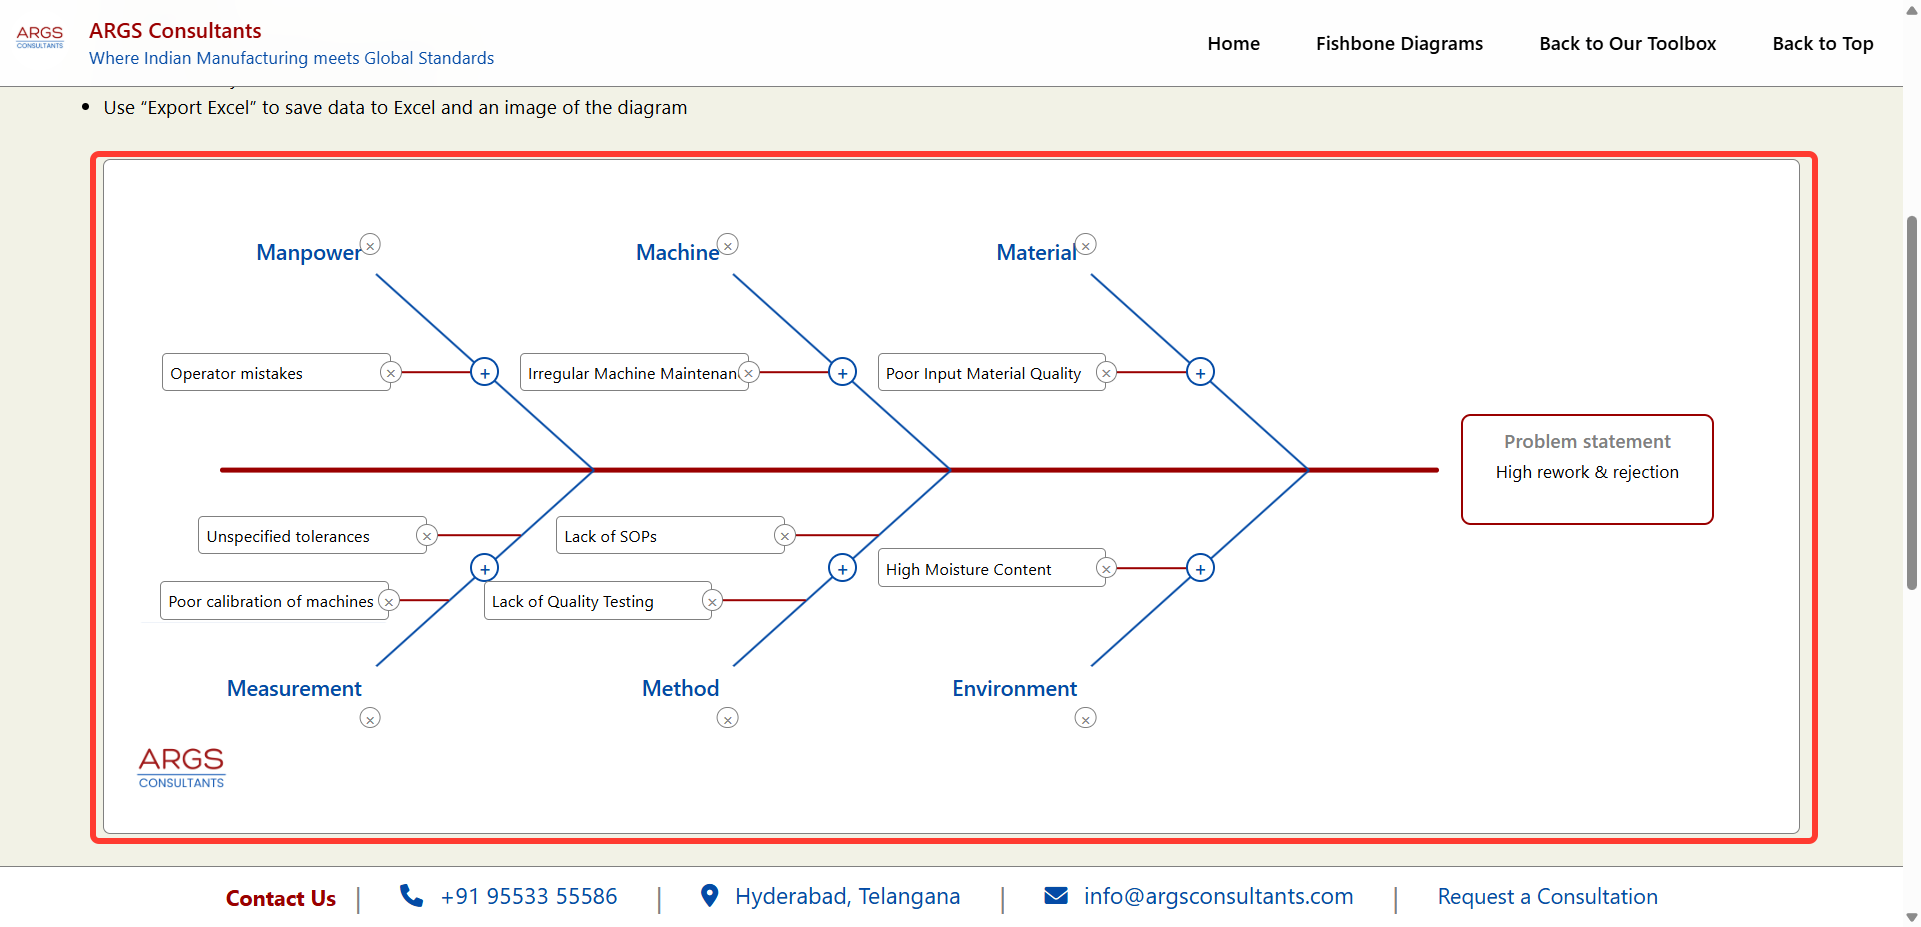
Once you have added all the causes, the fishbone diagram is completed. Scroll down and select "Move Causes to Table"
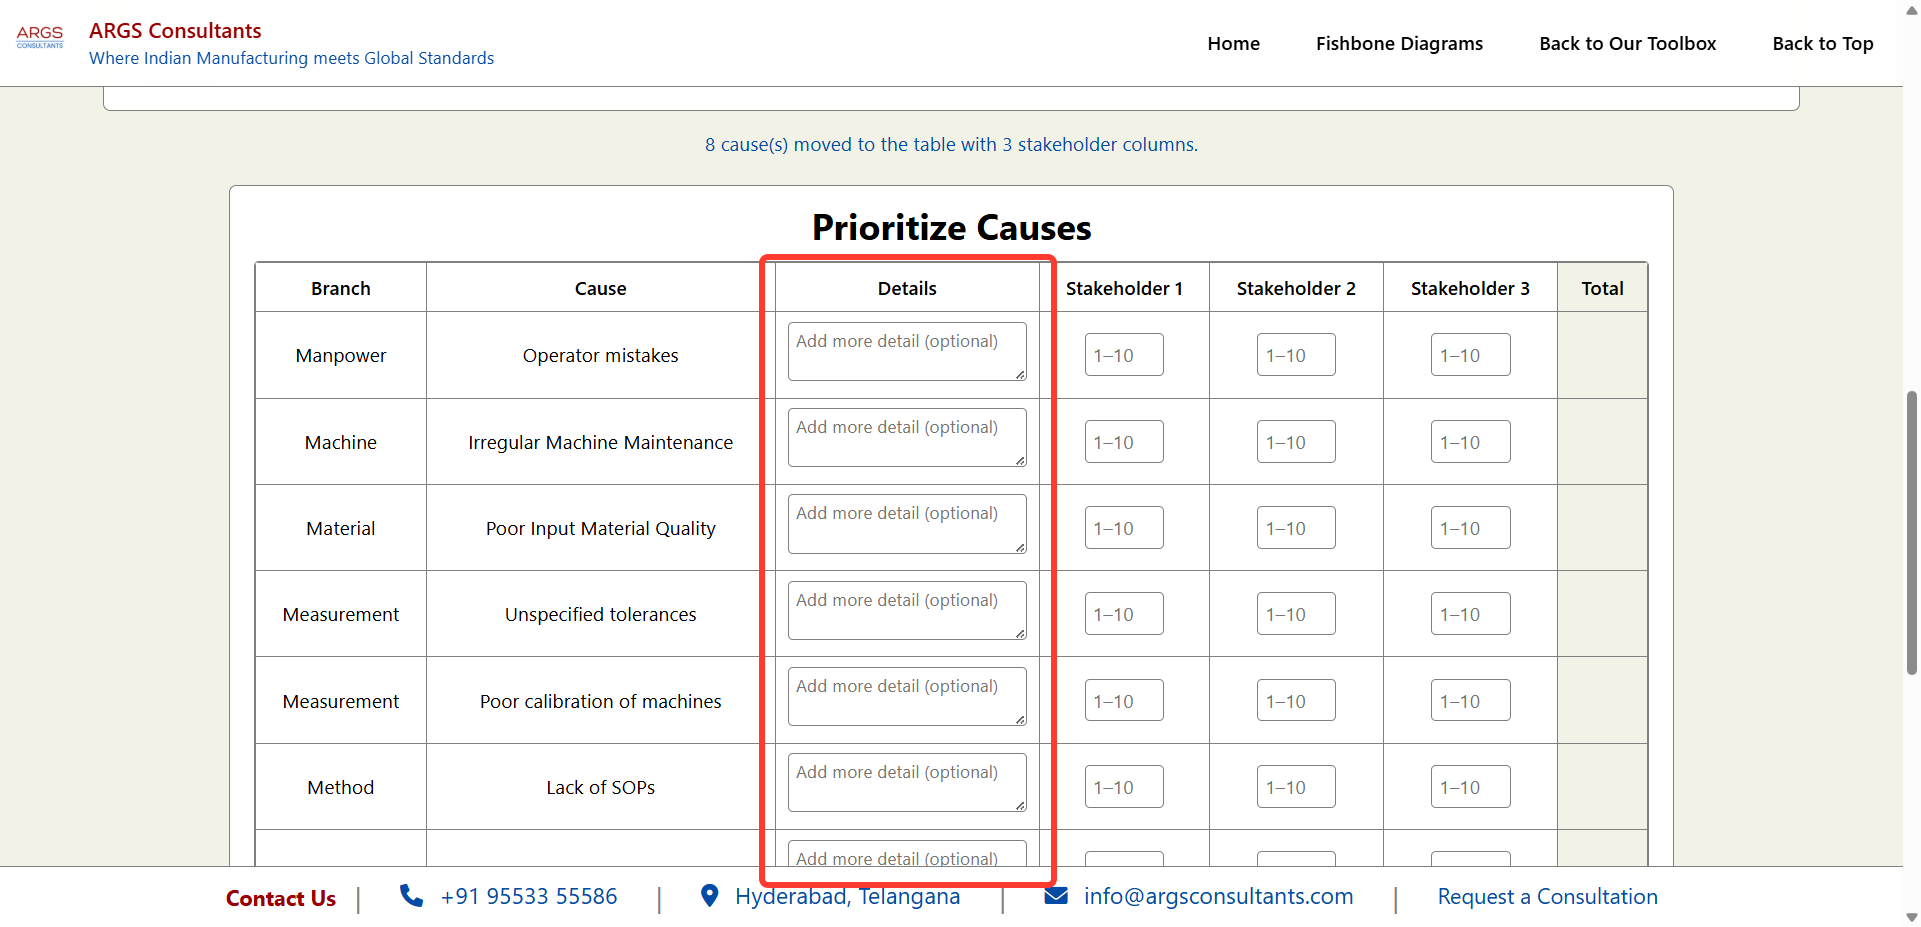
Start adding more details, wherever required
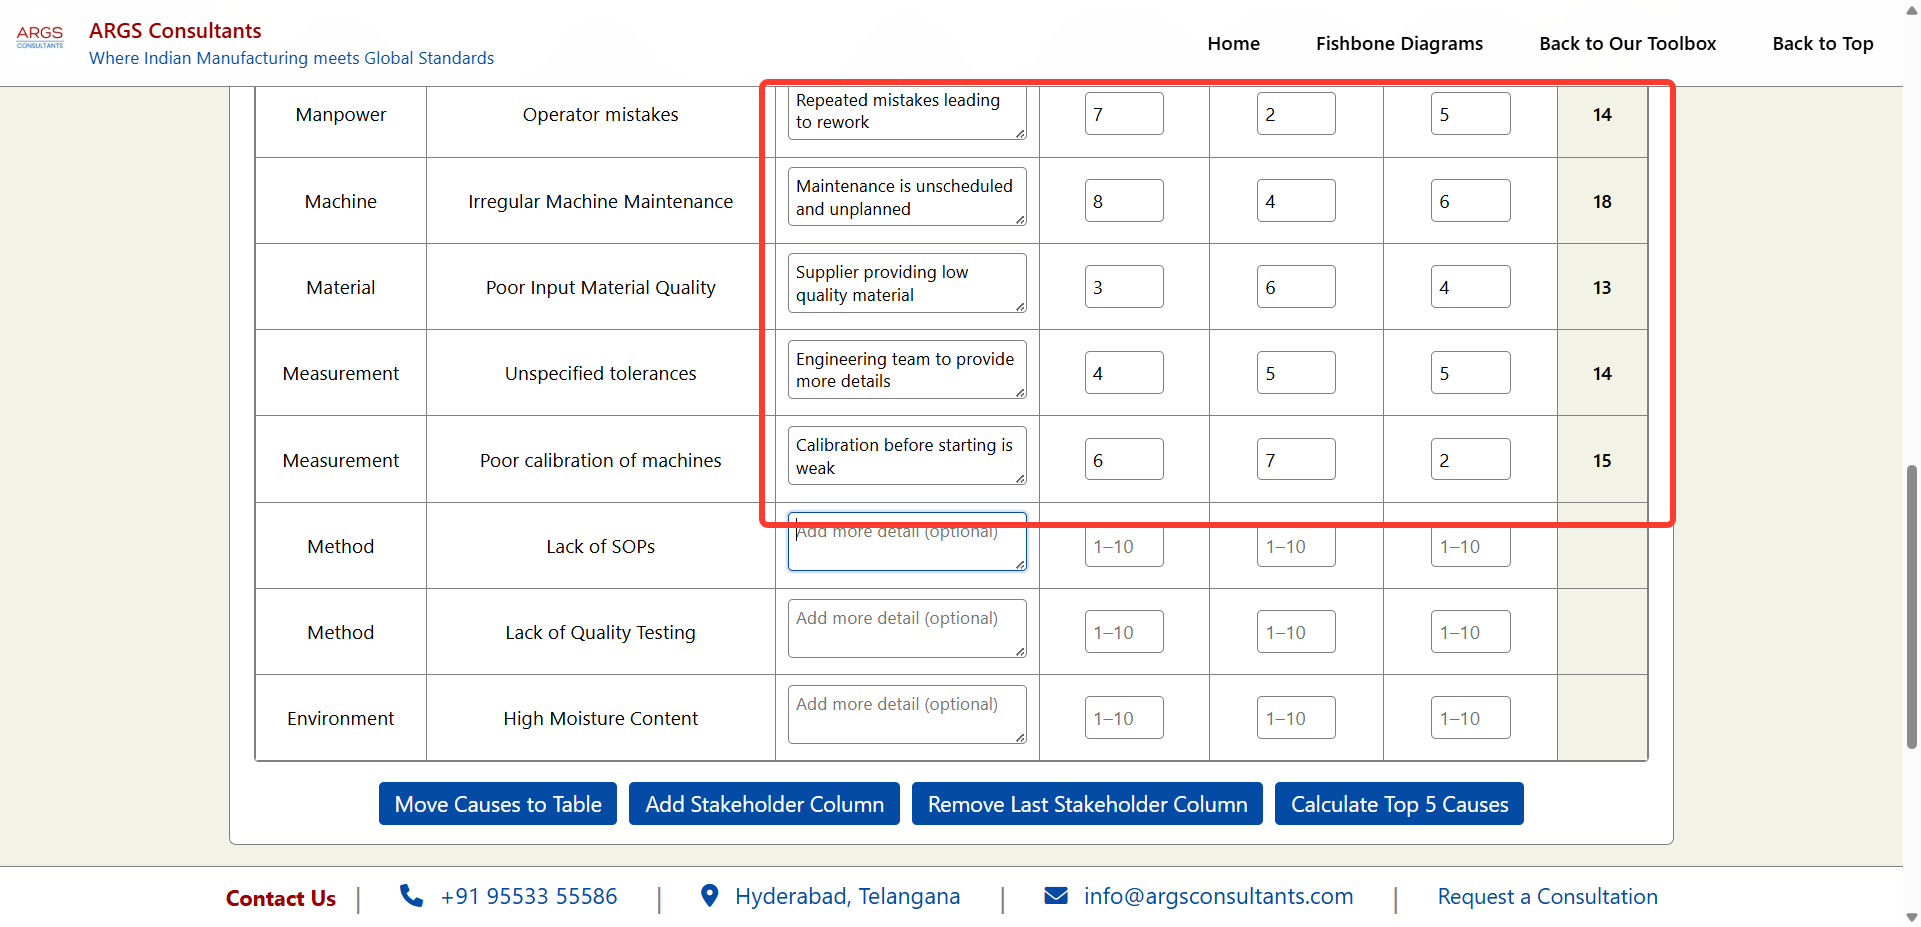
Add Details and a criticality score for each stakeholder against every cause. Note: Higher score means the impact of the cause is higher on the problem statement
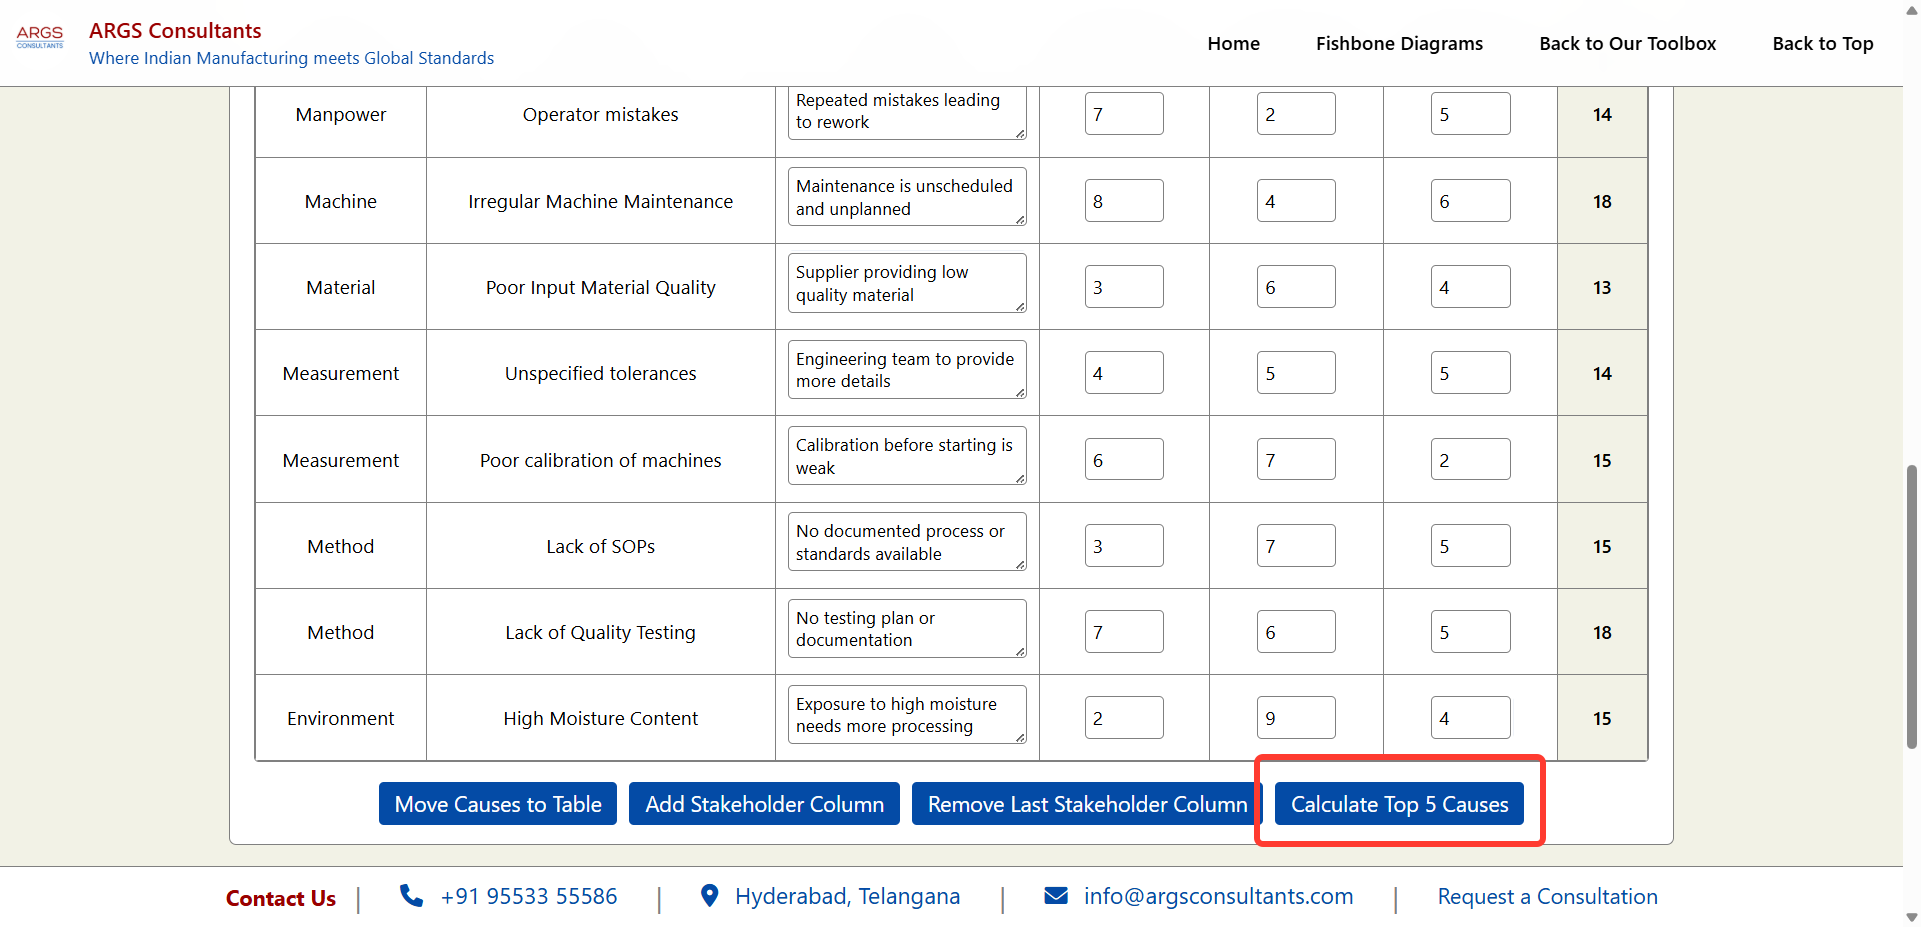
Once all details have been added, click "Calculate Top 5 Causes". This will identify the top 5 highest scores and highlight them
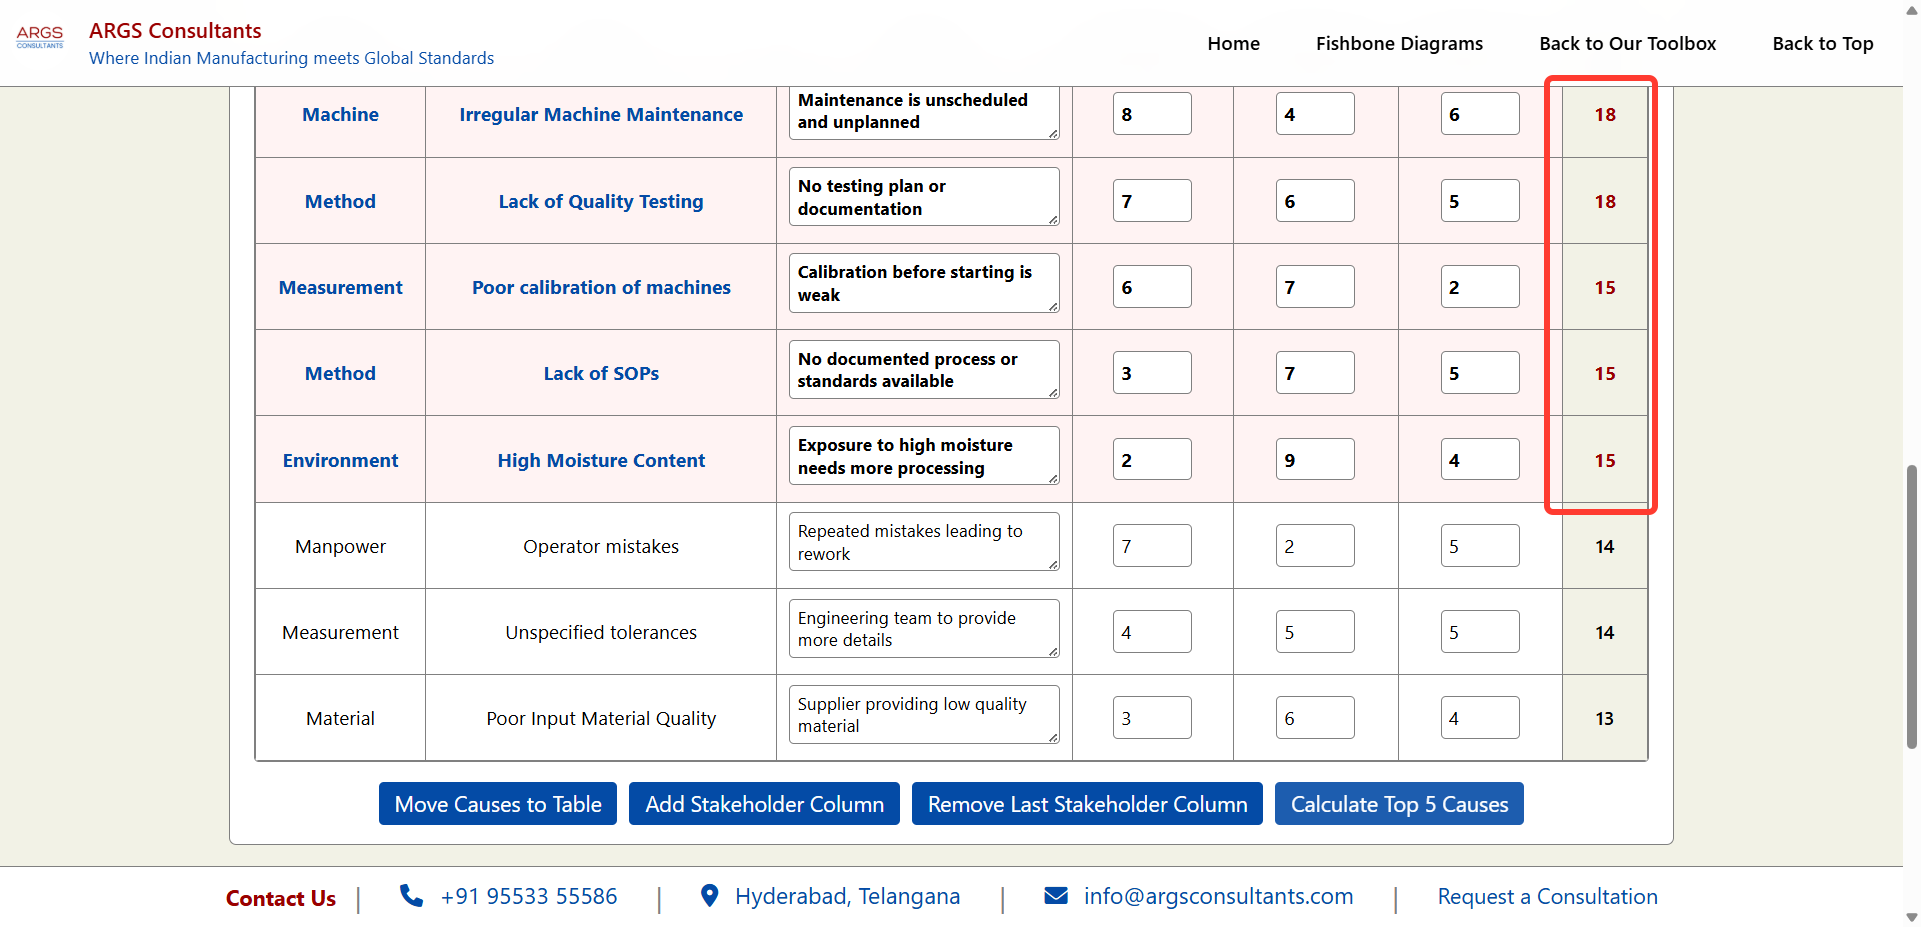
If the total score for any 2 or more causes are the same, they are given the same ranking. In this case, the top 2 causes are given Rank 1, the next 3 causes are given Rank 3, and the causes with score 14 are given Rank 6
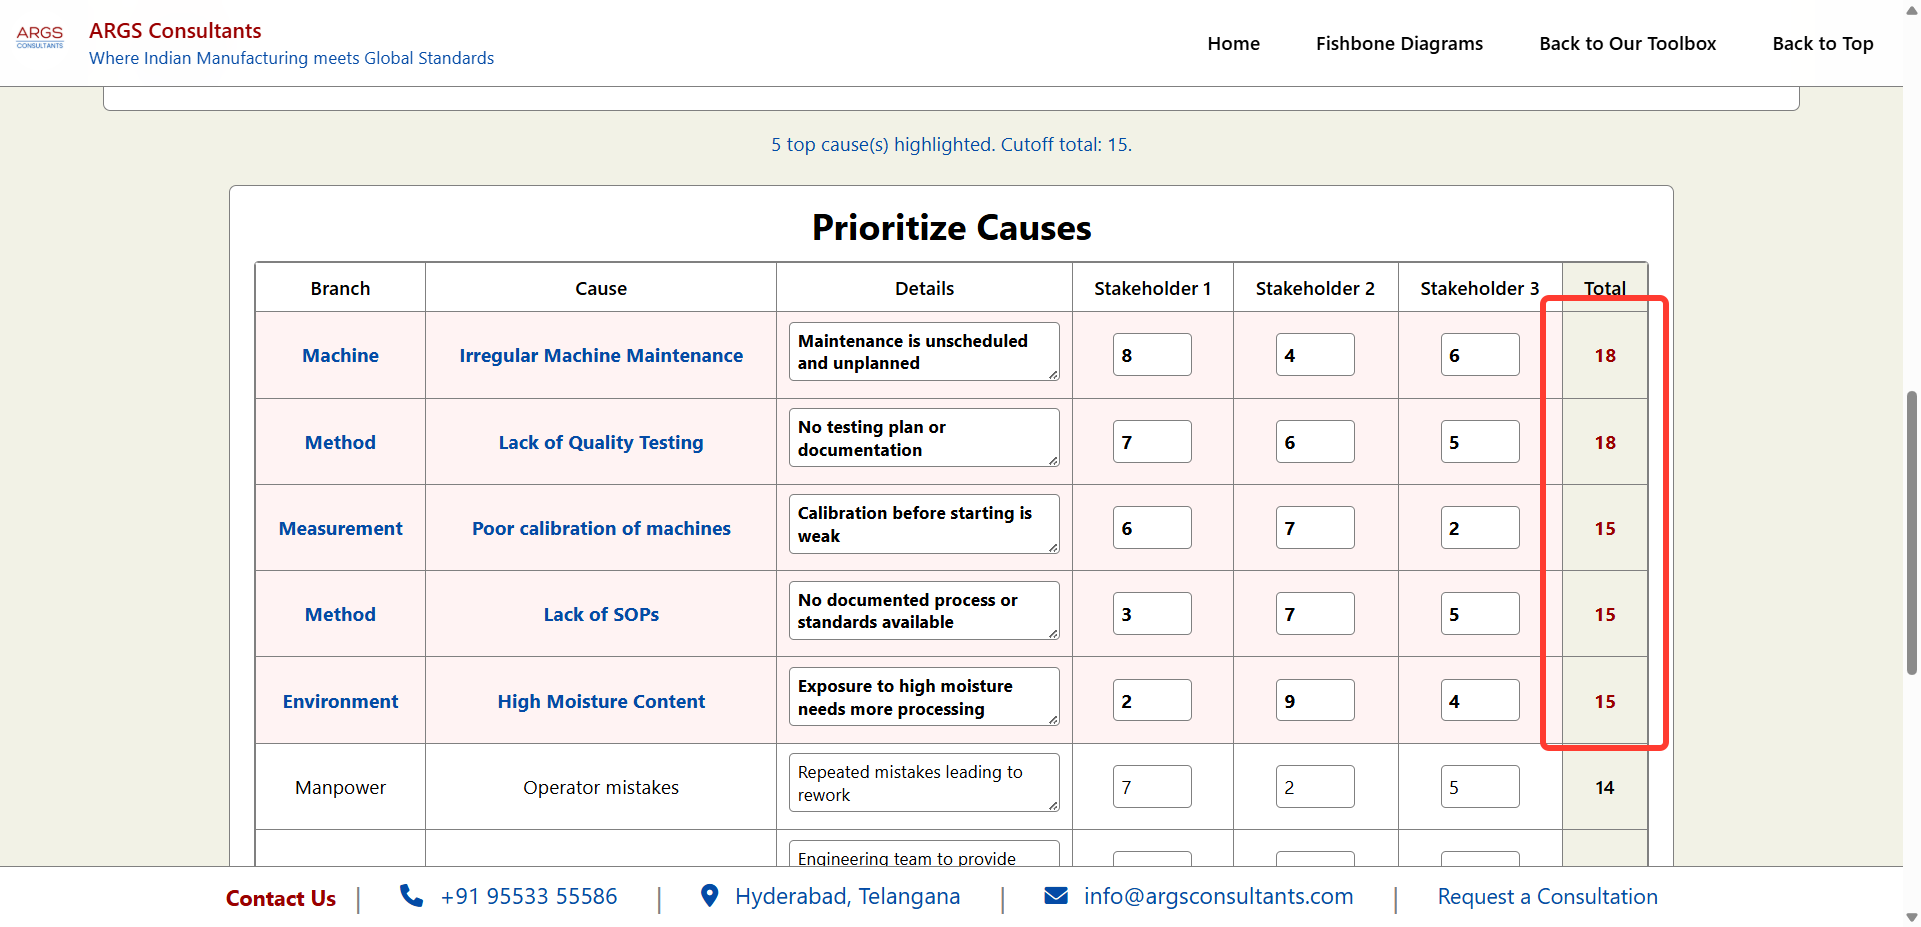
If the total score for any 2 or more causes are the same, they are given the same ranking. In this case, the top 2 causes are given Rank 1, the next 3 causes are given Rank 3, and the causes with score 14 are given Rank 6
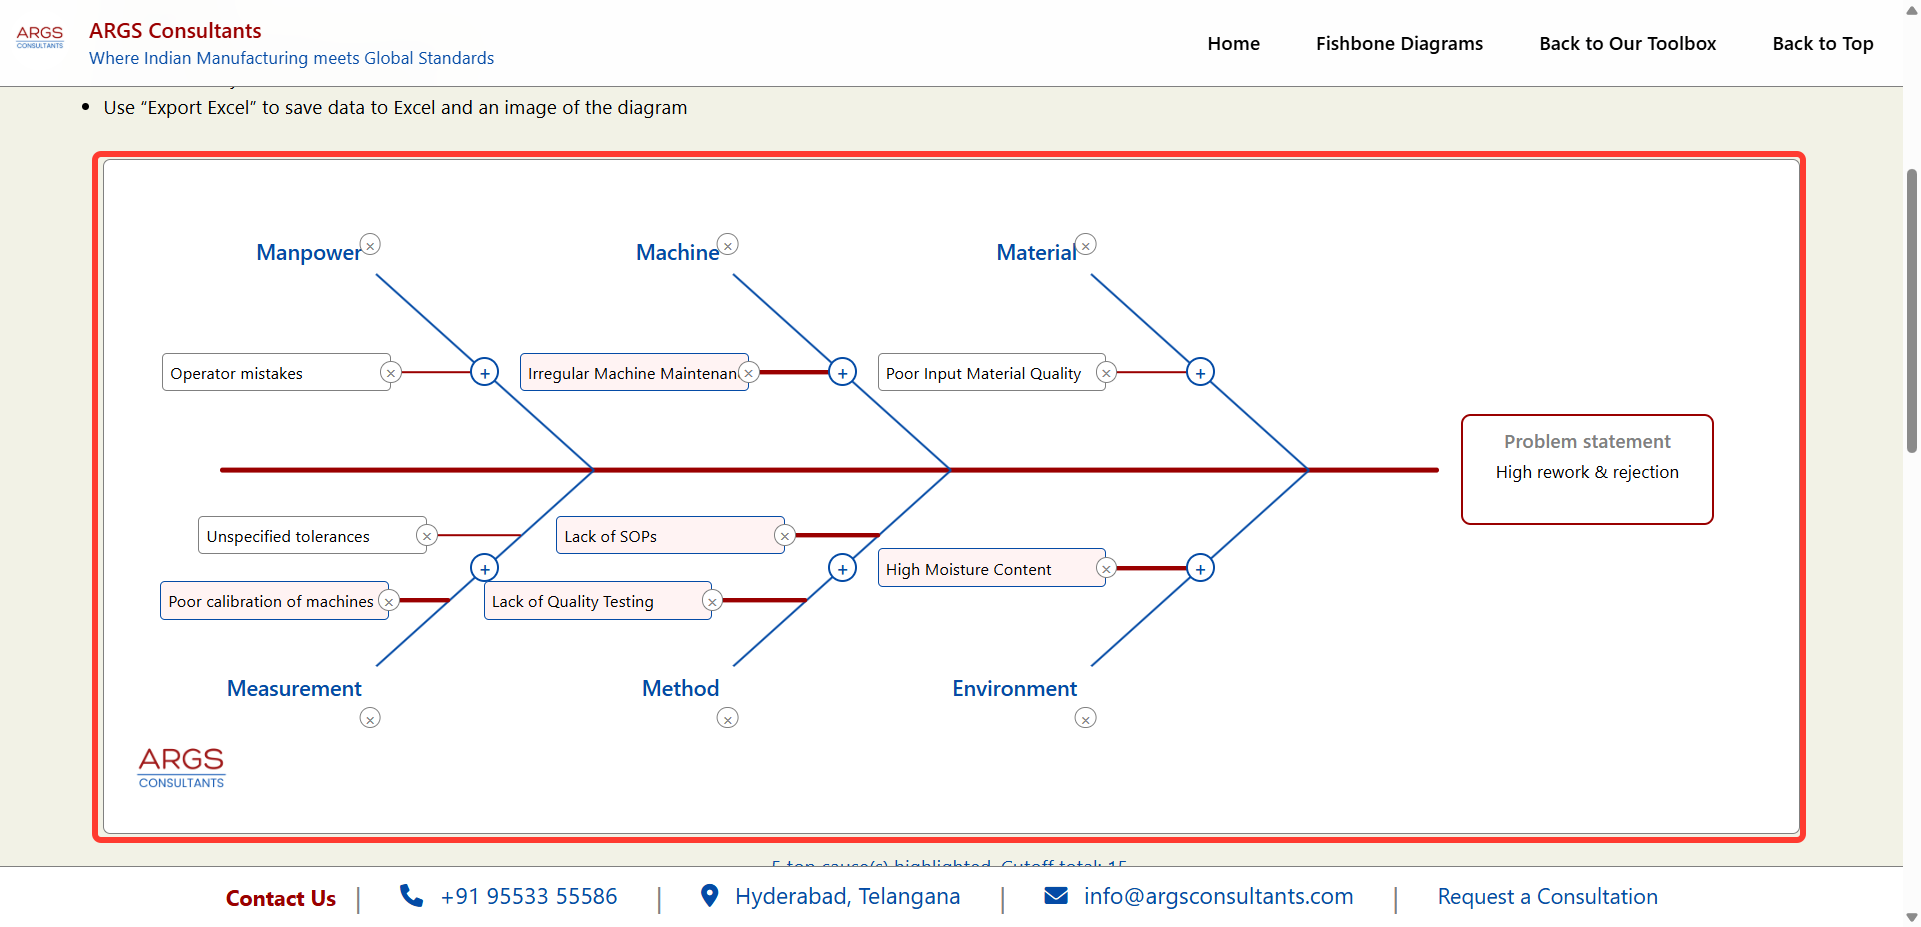
The causes are also highlighted within the fishbone diagram
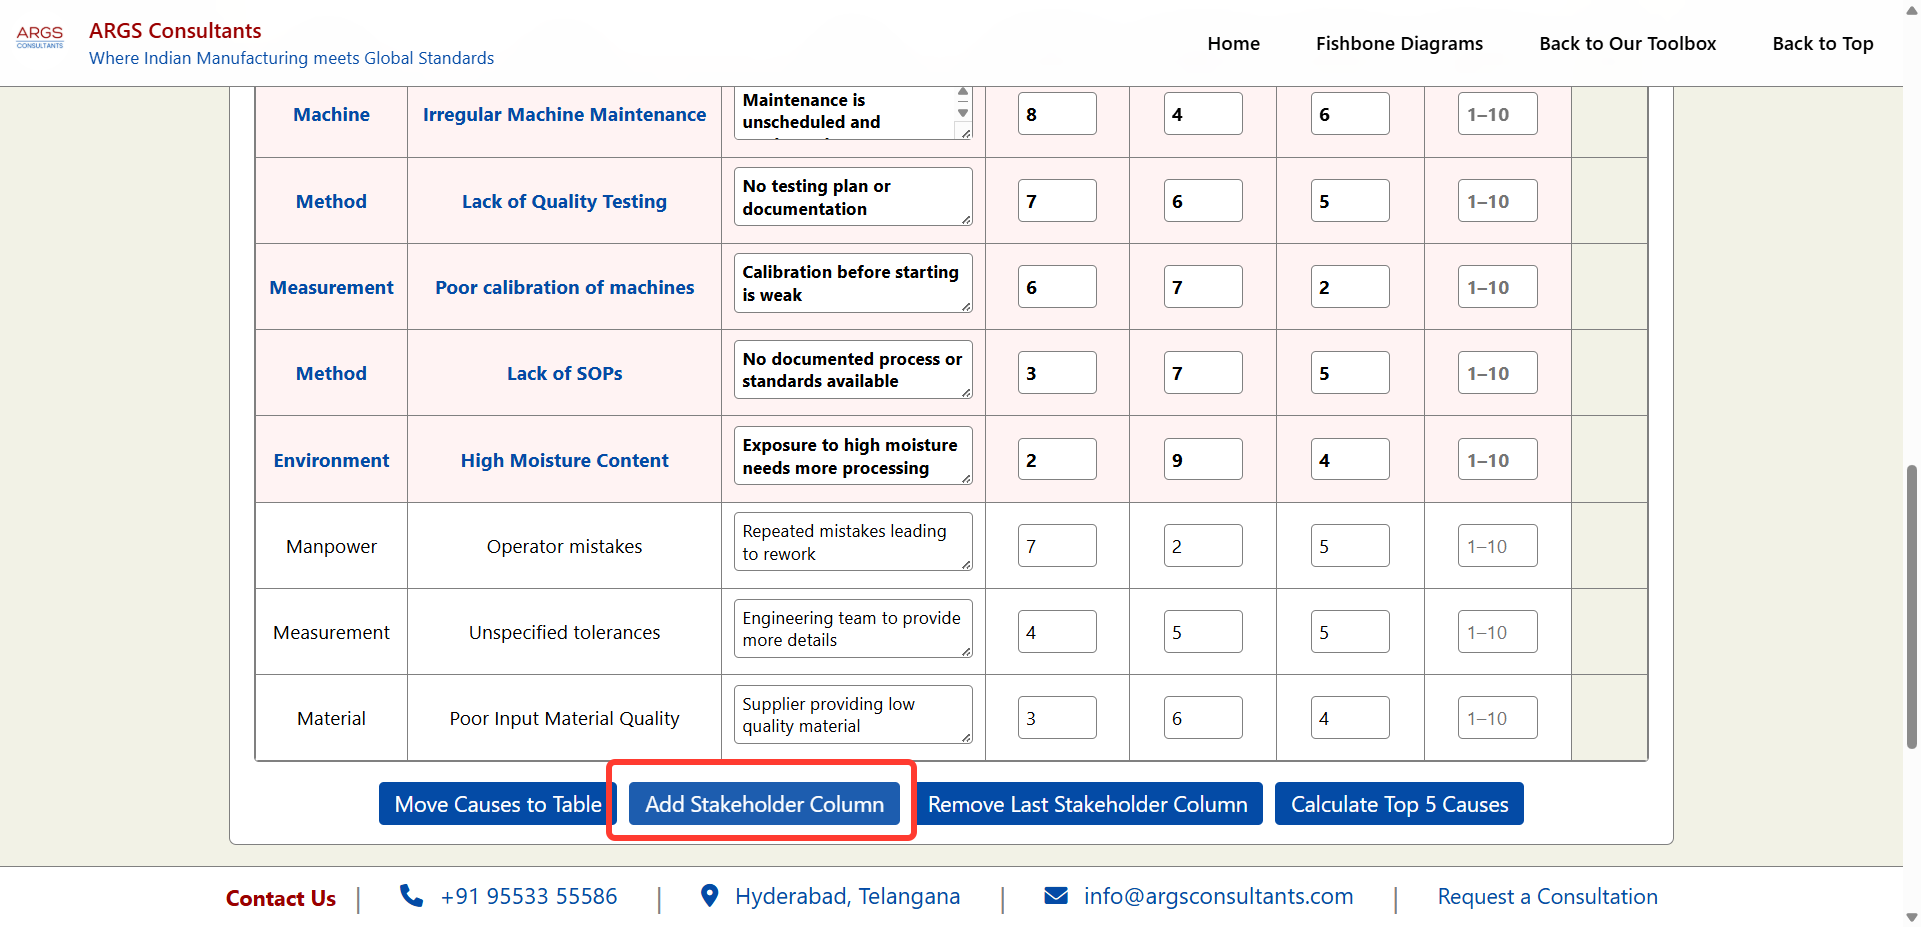
Click "Add Stakeholder Column" if you want to capture the inputs from an additional stakeholder. Note: The inputs already given will not be changed
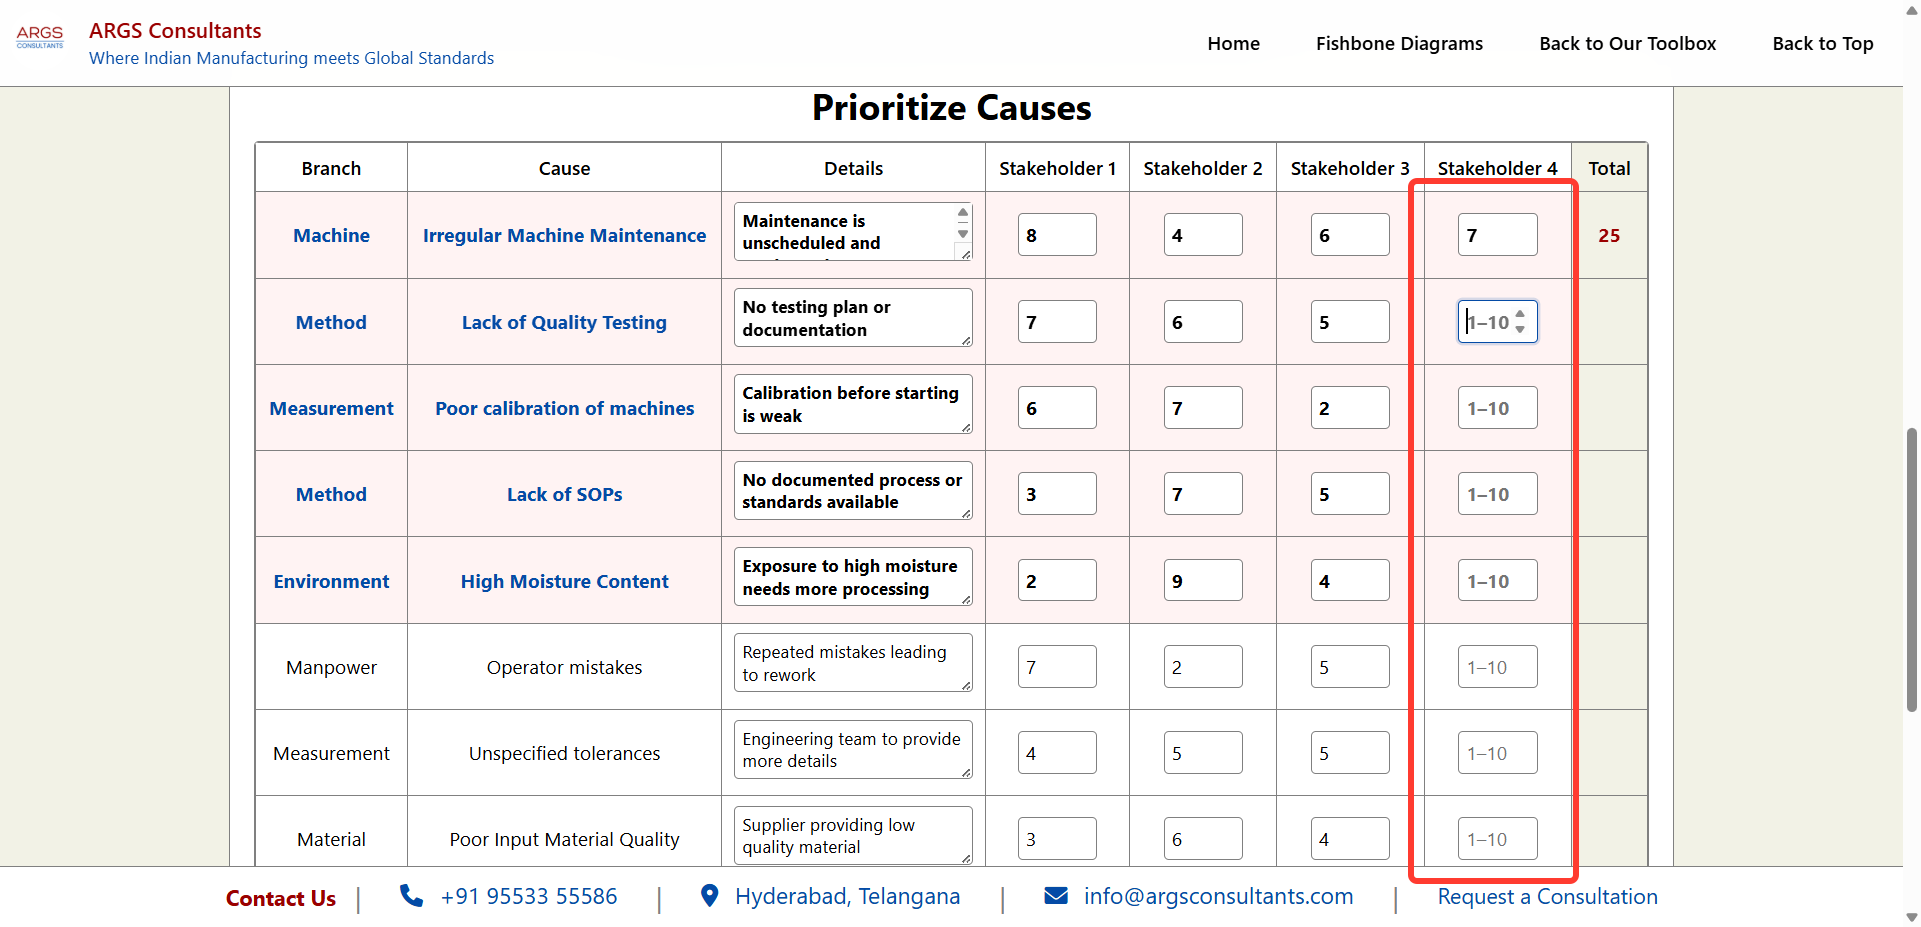
Add Stakeholder 4's score for every cause. The totals will be recalculated as and when the additional stakeholder input is provided.
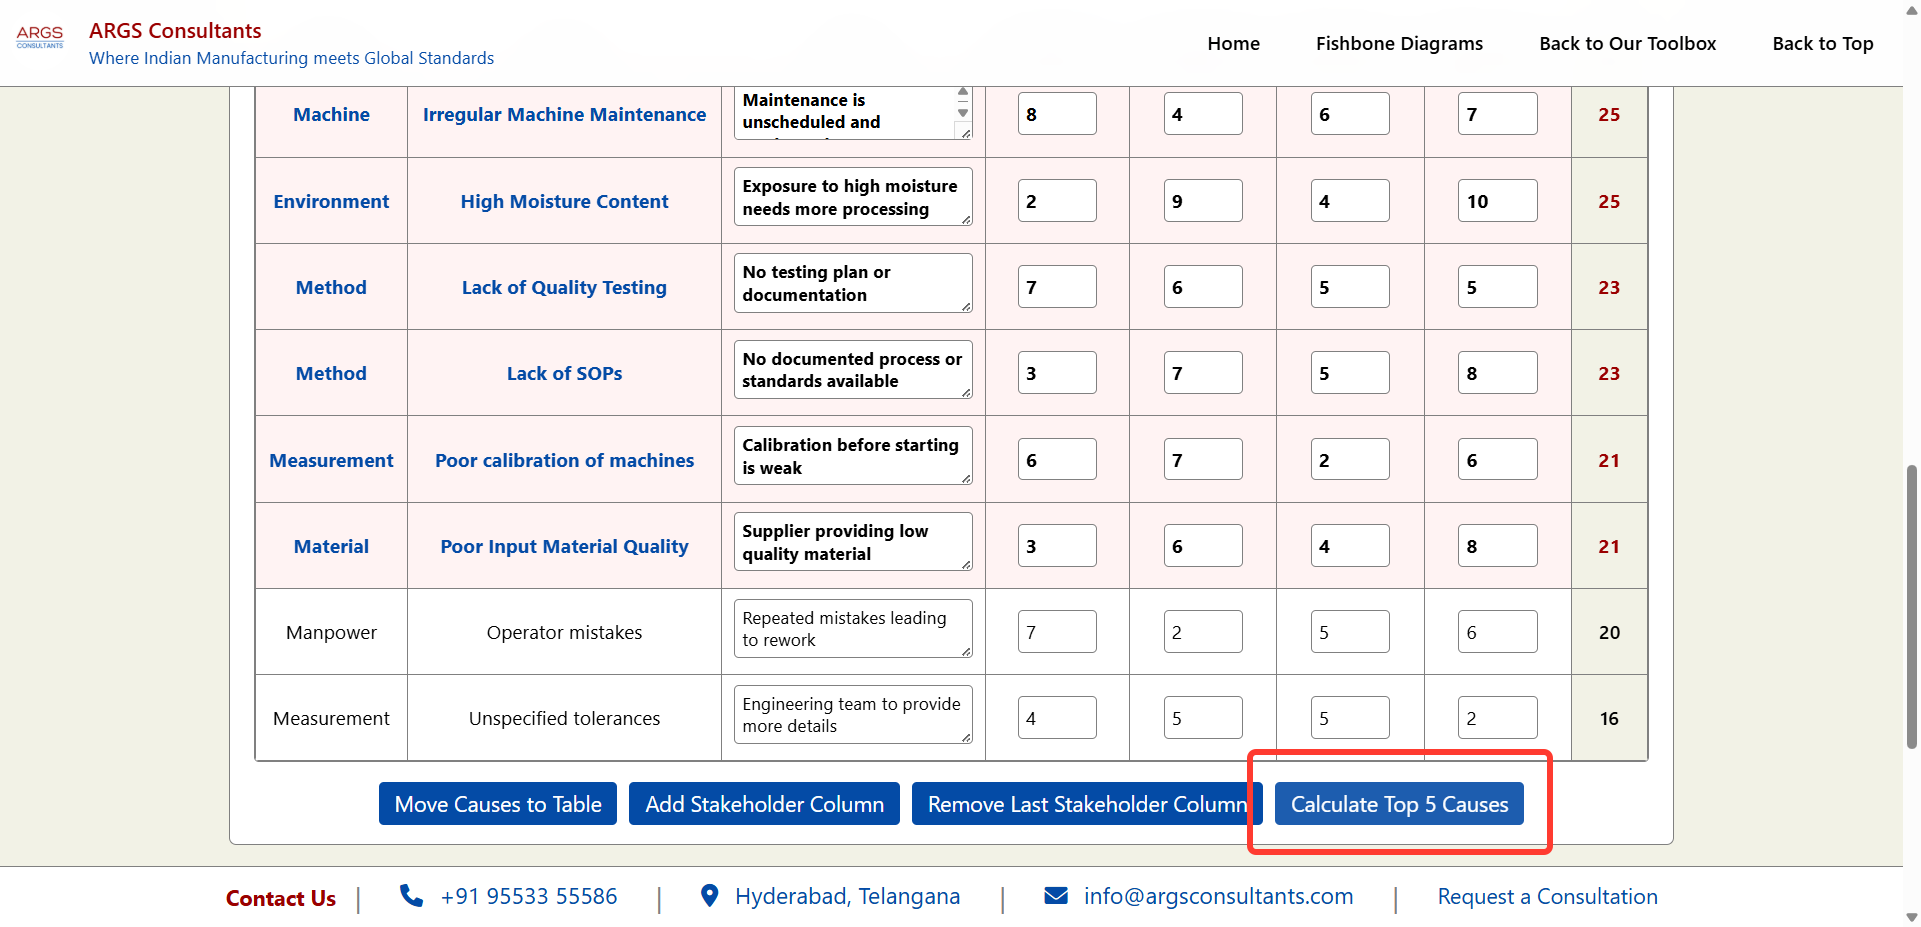
Click again on "Calculate Top 5 Causes" to sort the table according to the new totals, and highlight the new top causes.
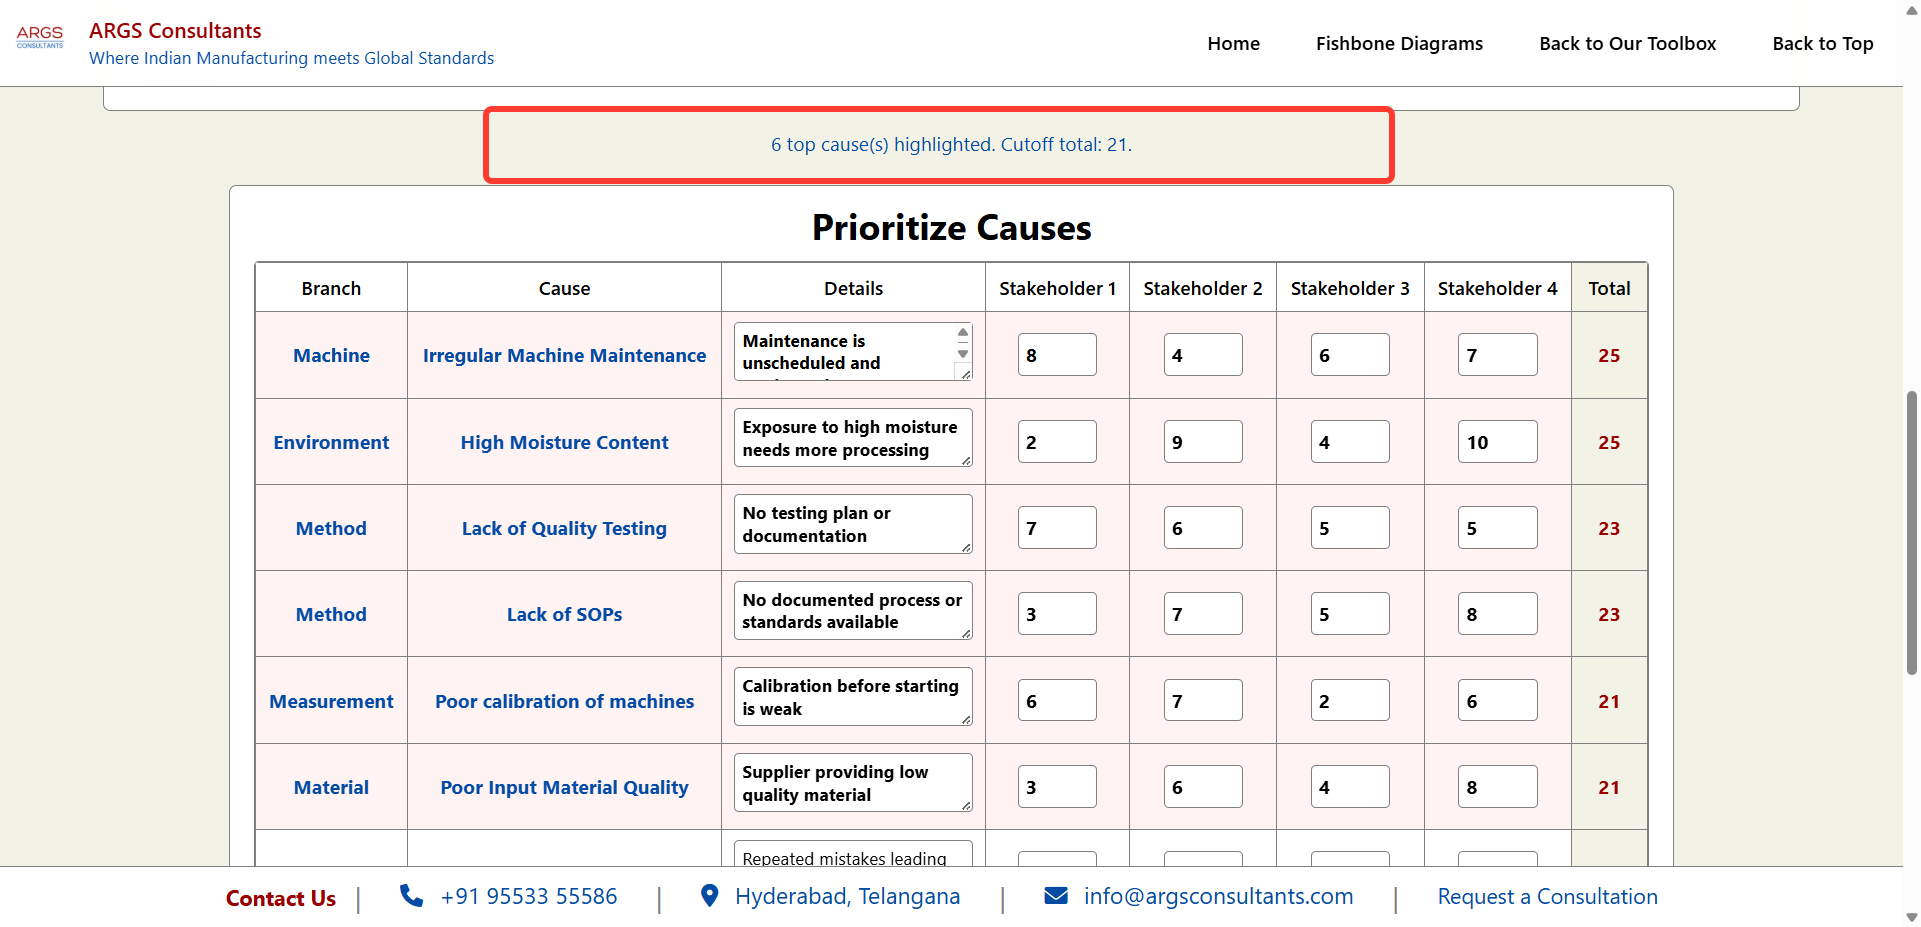
New top causes have been identified and highlighted within the table, as well as the fishbone diagram itself.
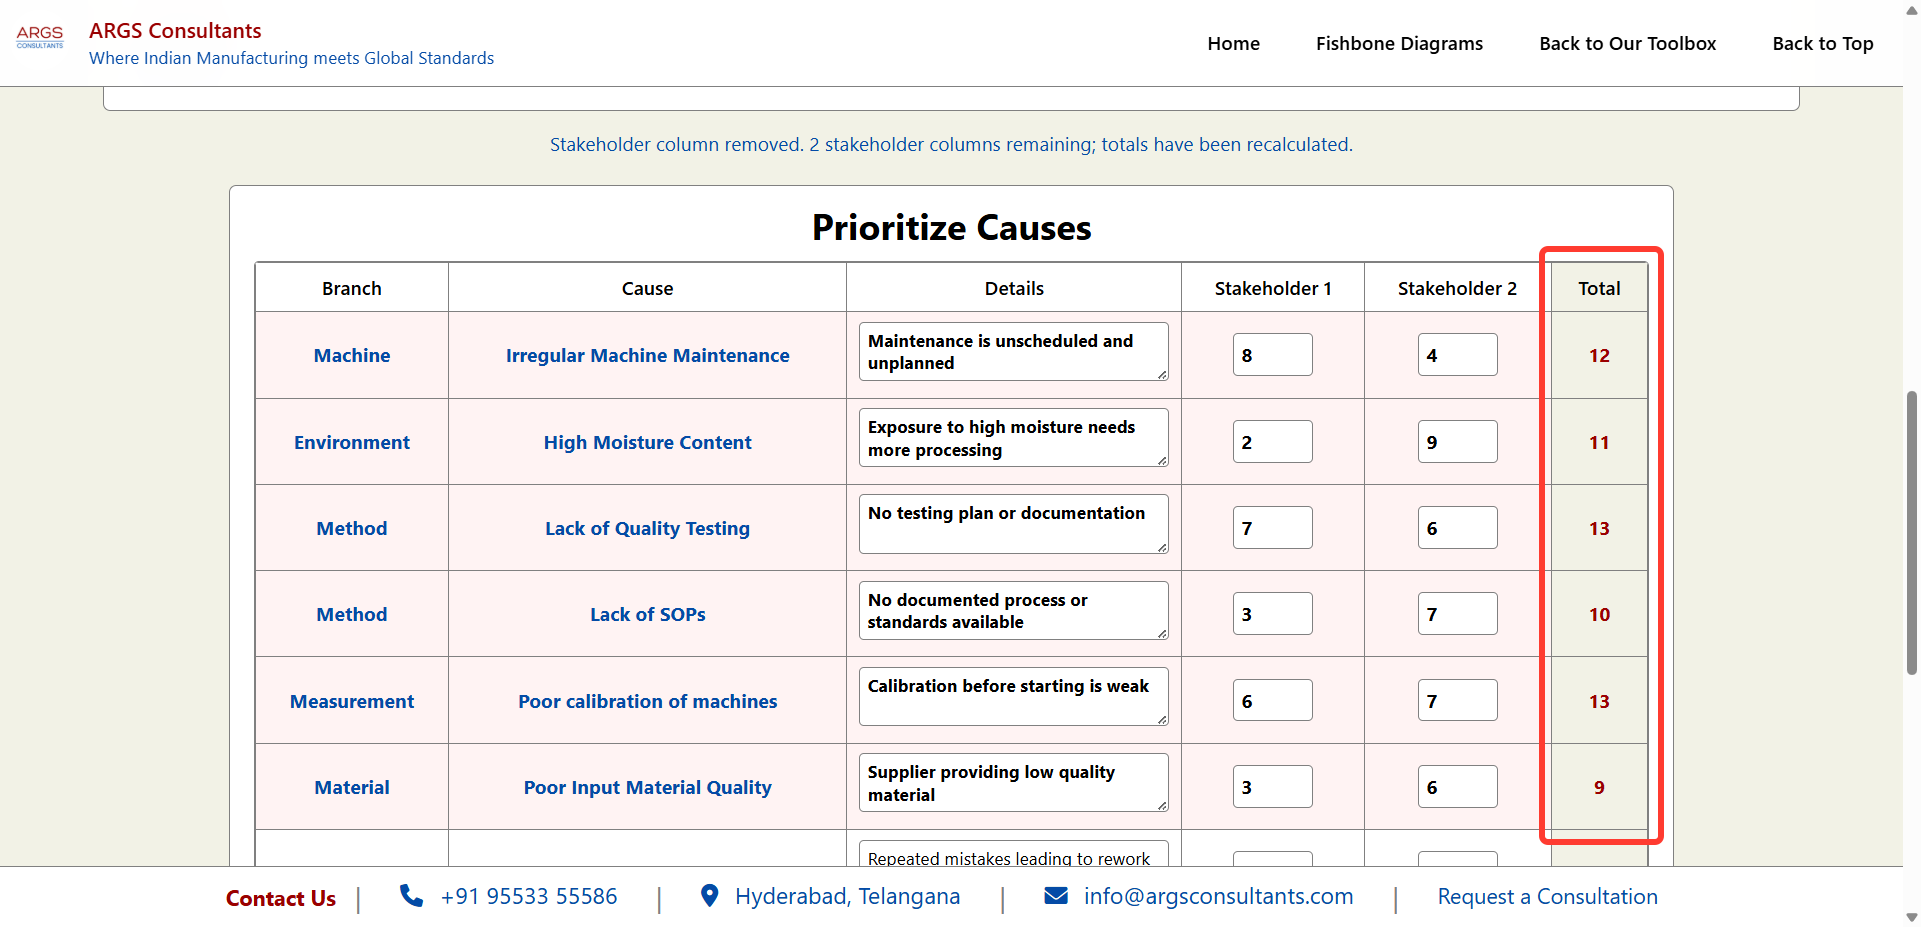
The totals have been recalculated. To sort the table and highlight top causes, click "Calculate Top 5 Causes" again
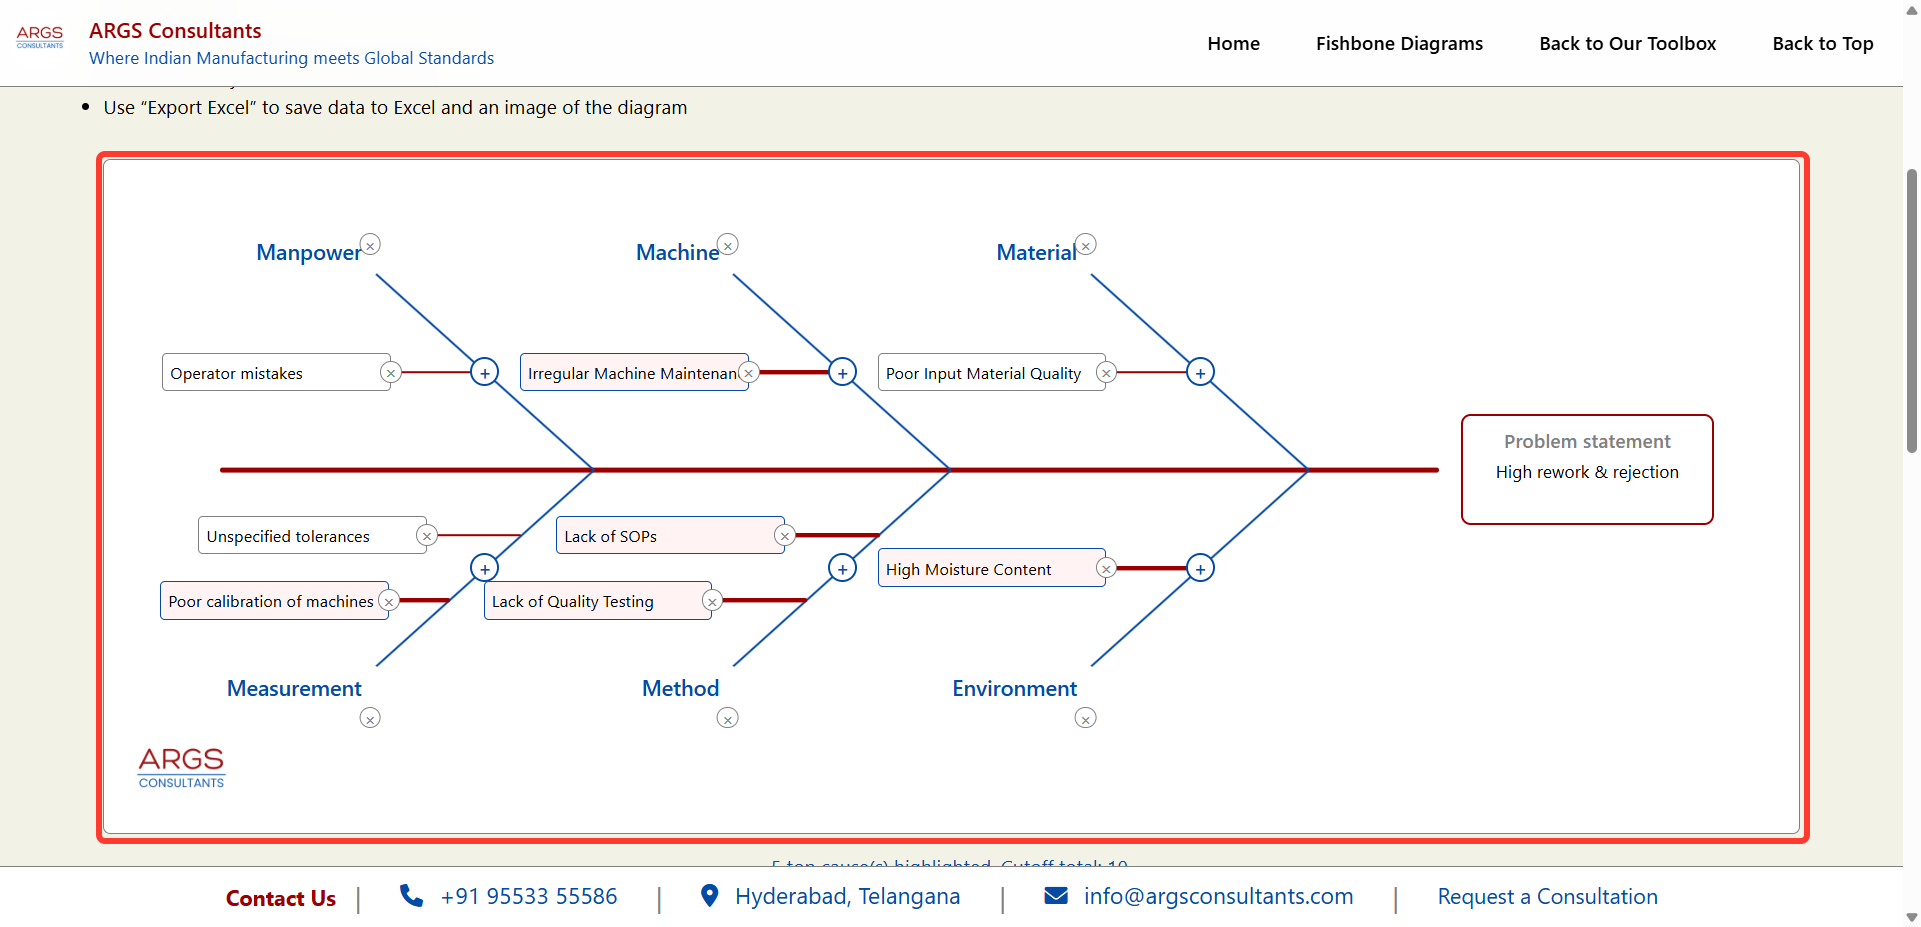
The recalculated top causes will be highlighted in the diagram
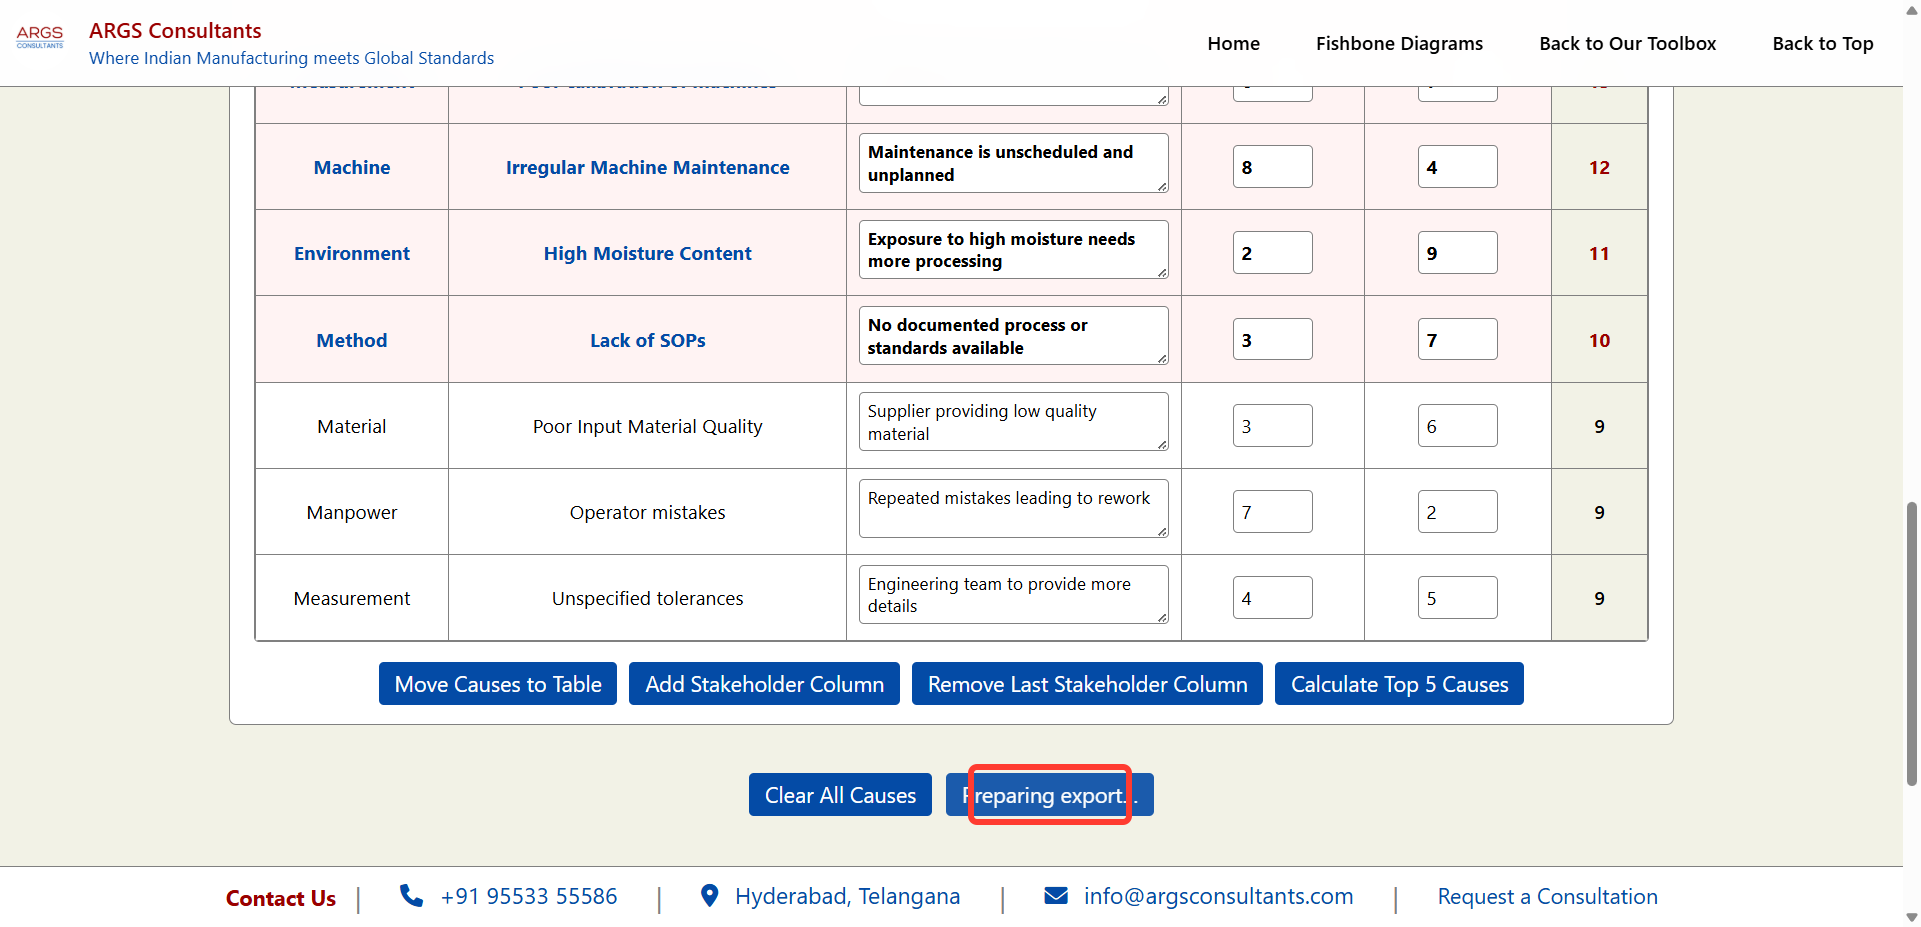
Click "Export Excel" to start the download a copy of the table in an MS Excel file with an embedded copy of the fishbone diagram
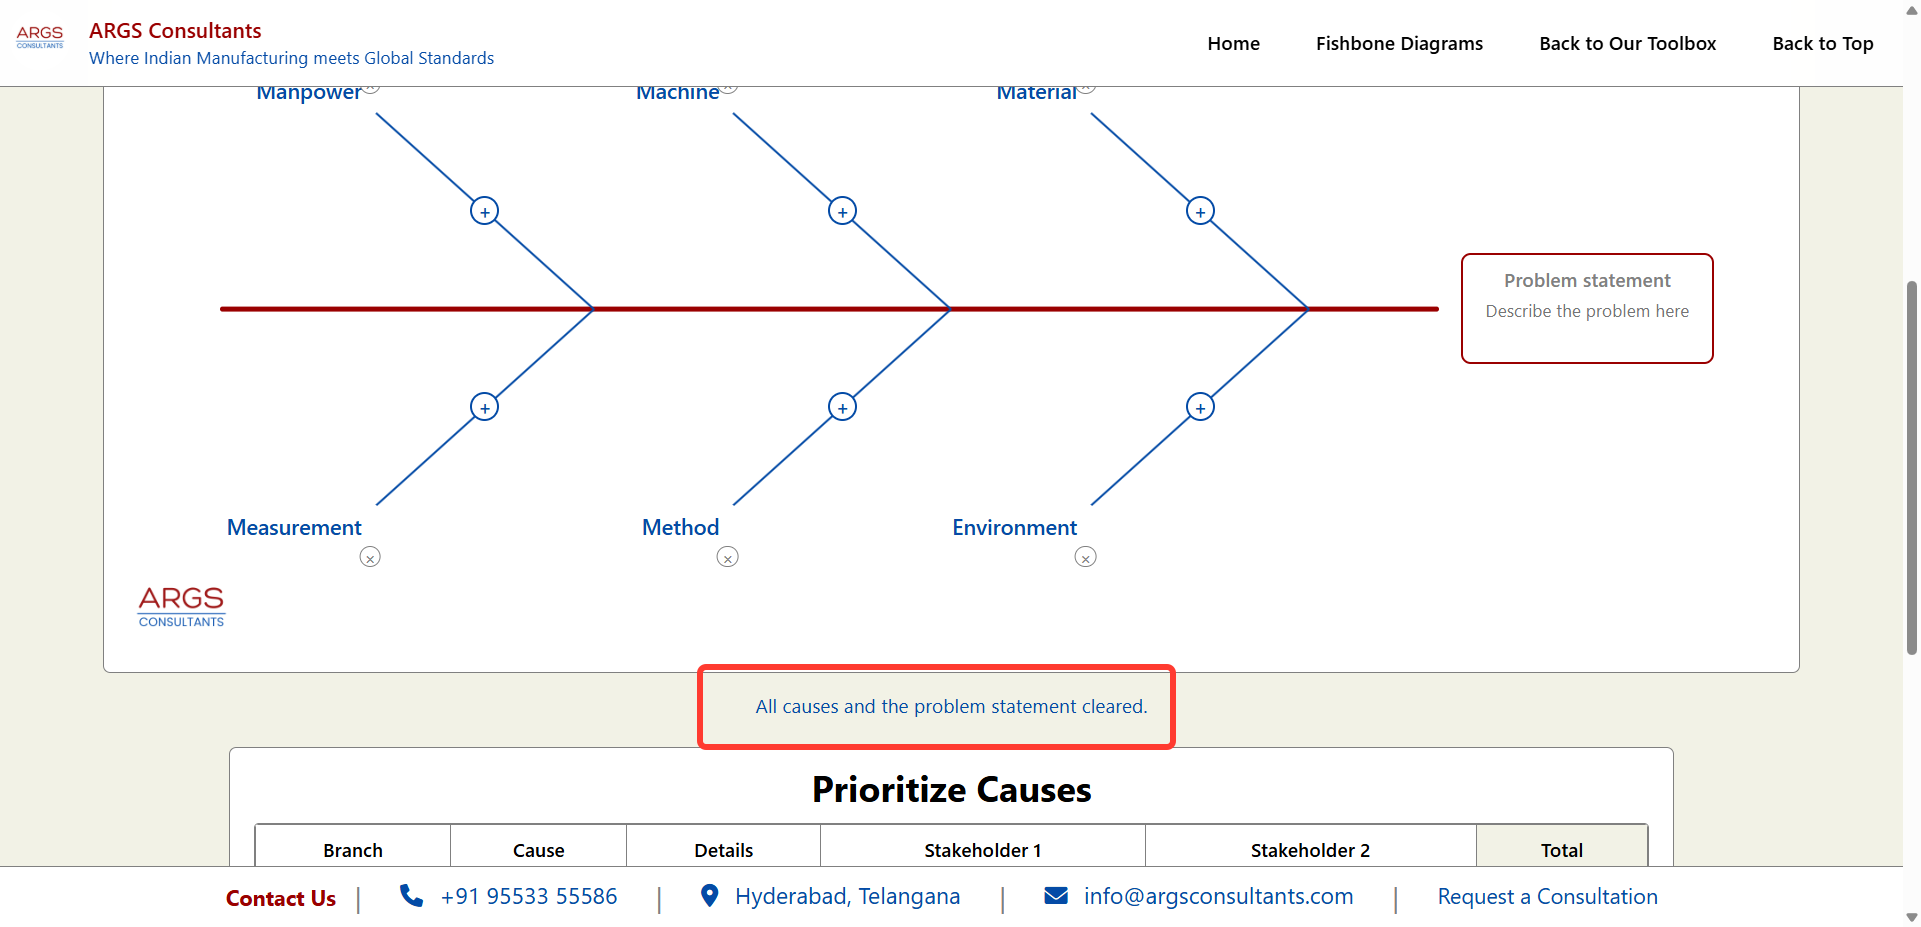
Click "Clear All Causes" to remove all causes and the problem statement. The tool can be used for a fresh problem statement. Note: If you refresh the page or navigate away from it, all data will be lost and the entire diagram has to be created from scratch
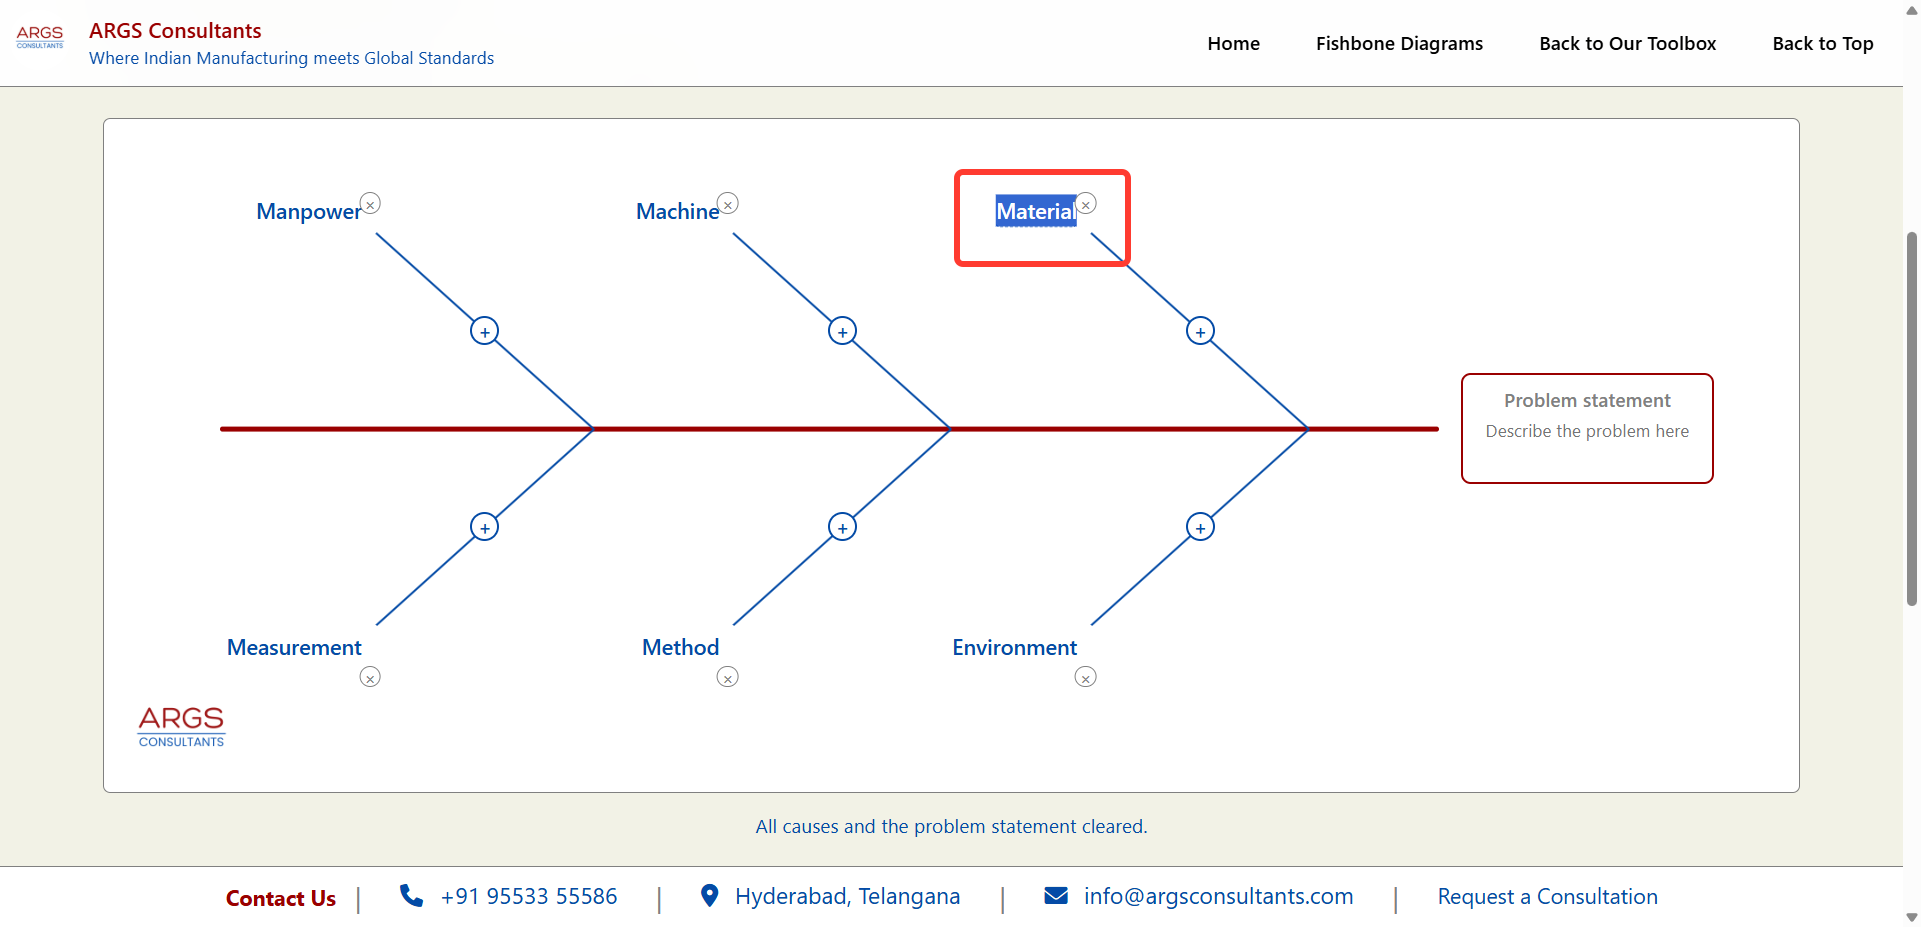
Note: You can change the name of the branch according to your convenience
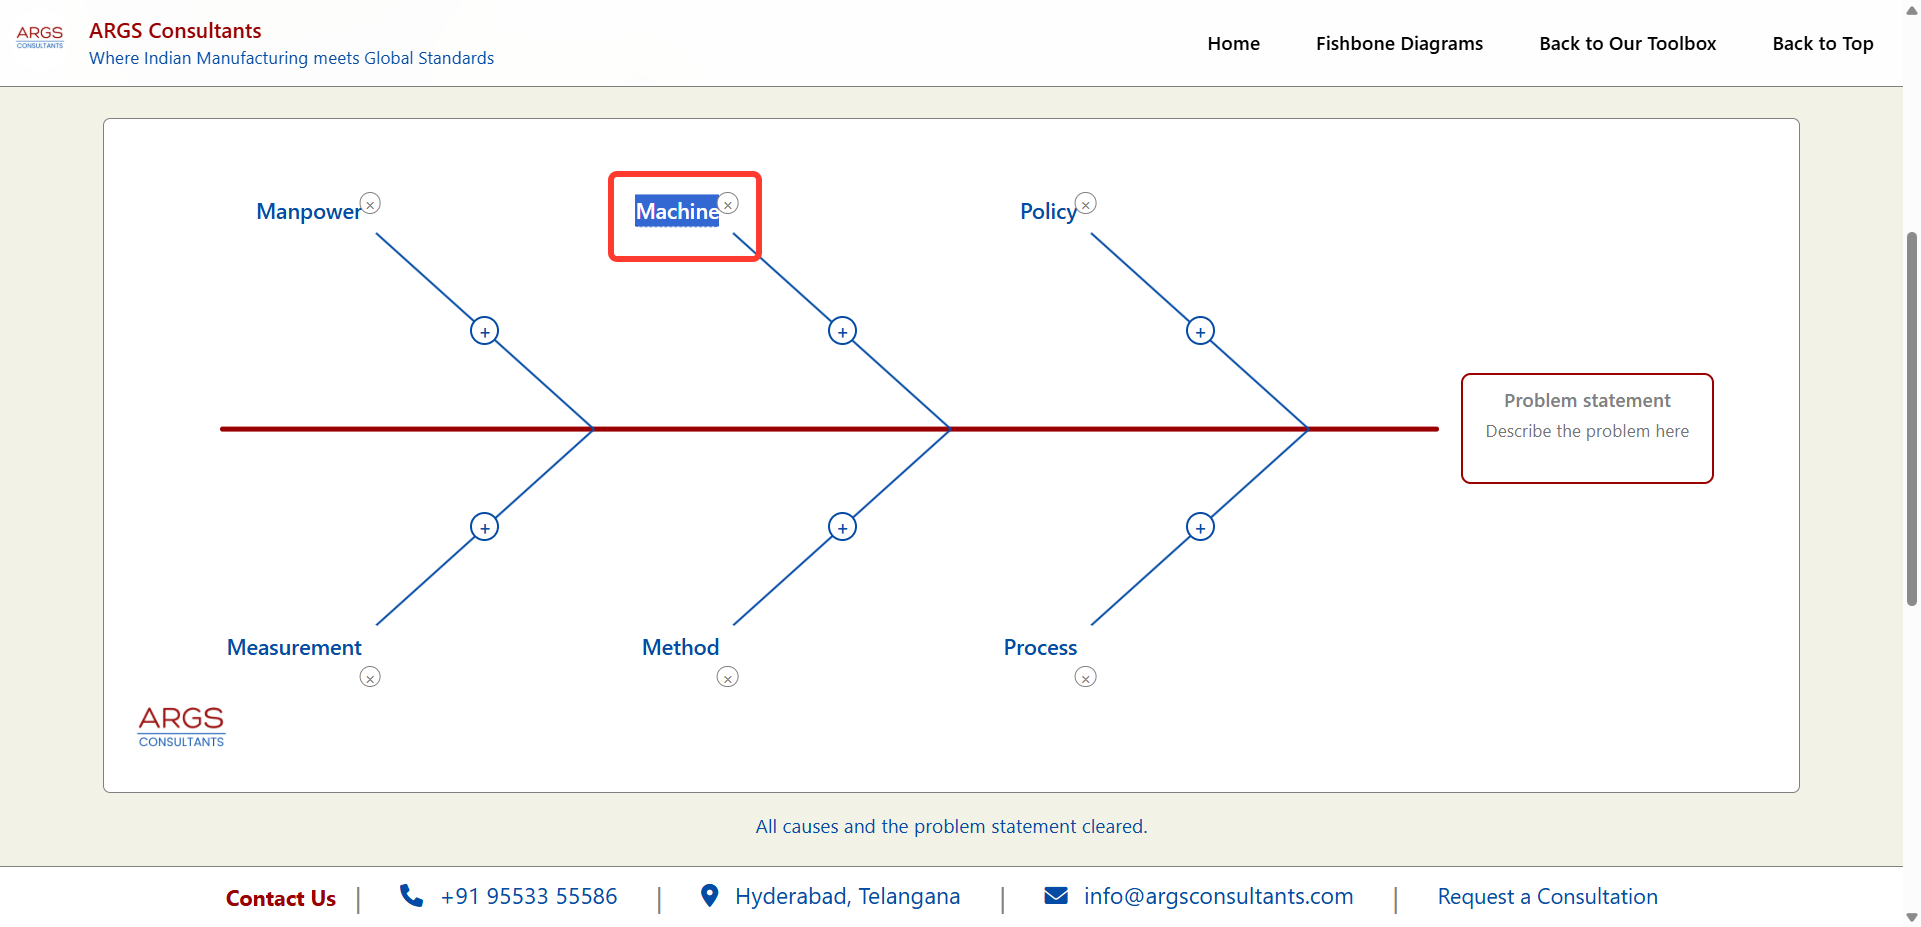
Another popular template for Service industry are - Policy, Process, Procedure, People. In this case, we can rename the branches appropriately.
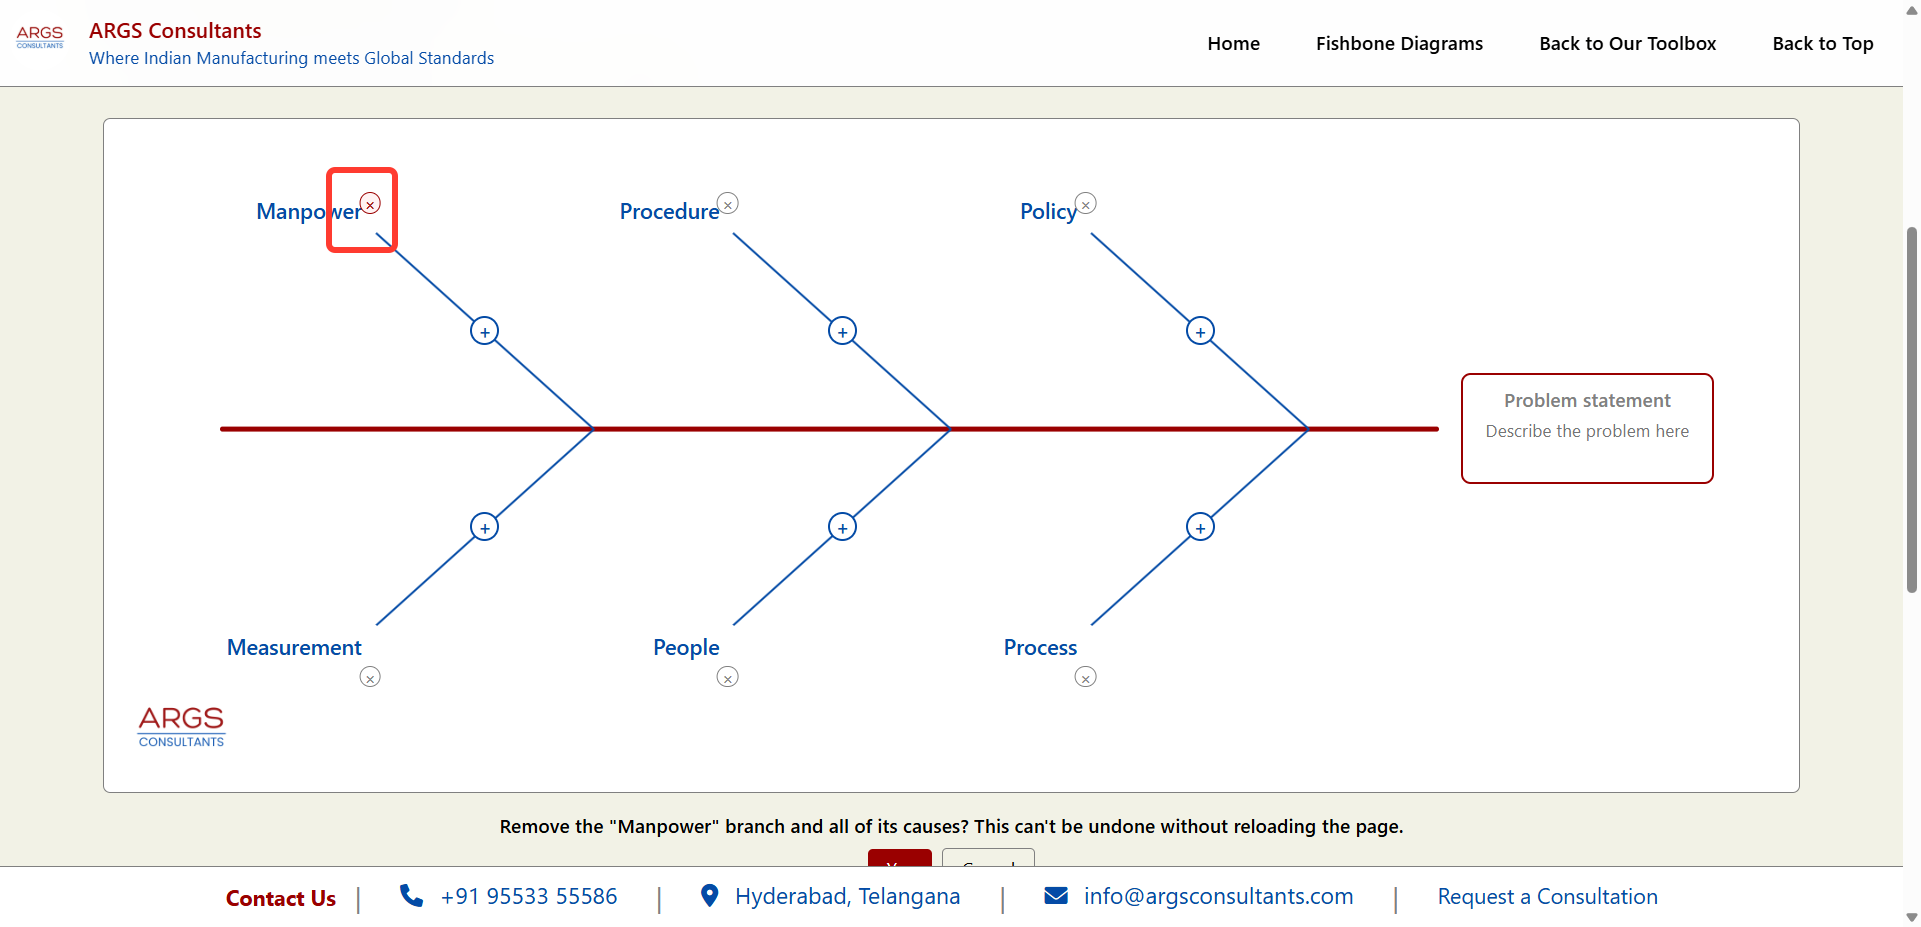
Click on "Remove" button and select "Yes" to remove Manpower branch and its causes
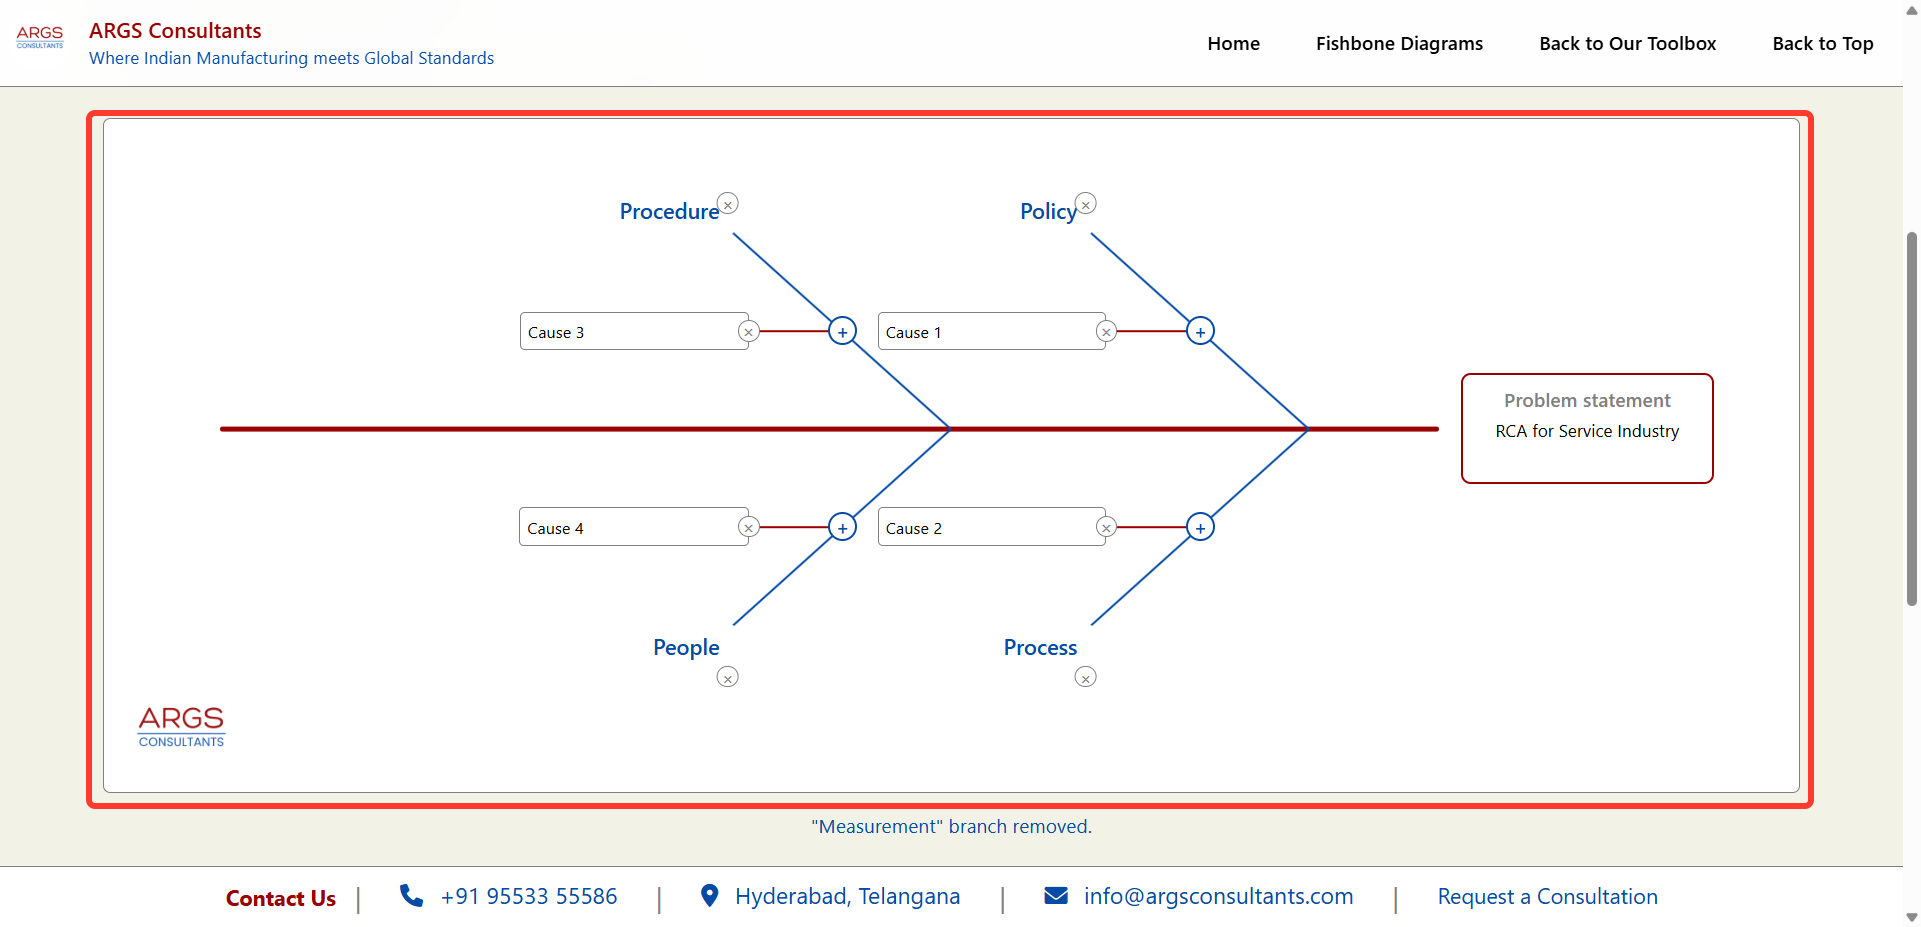
A Representative Fishbone diagram for Service Industry
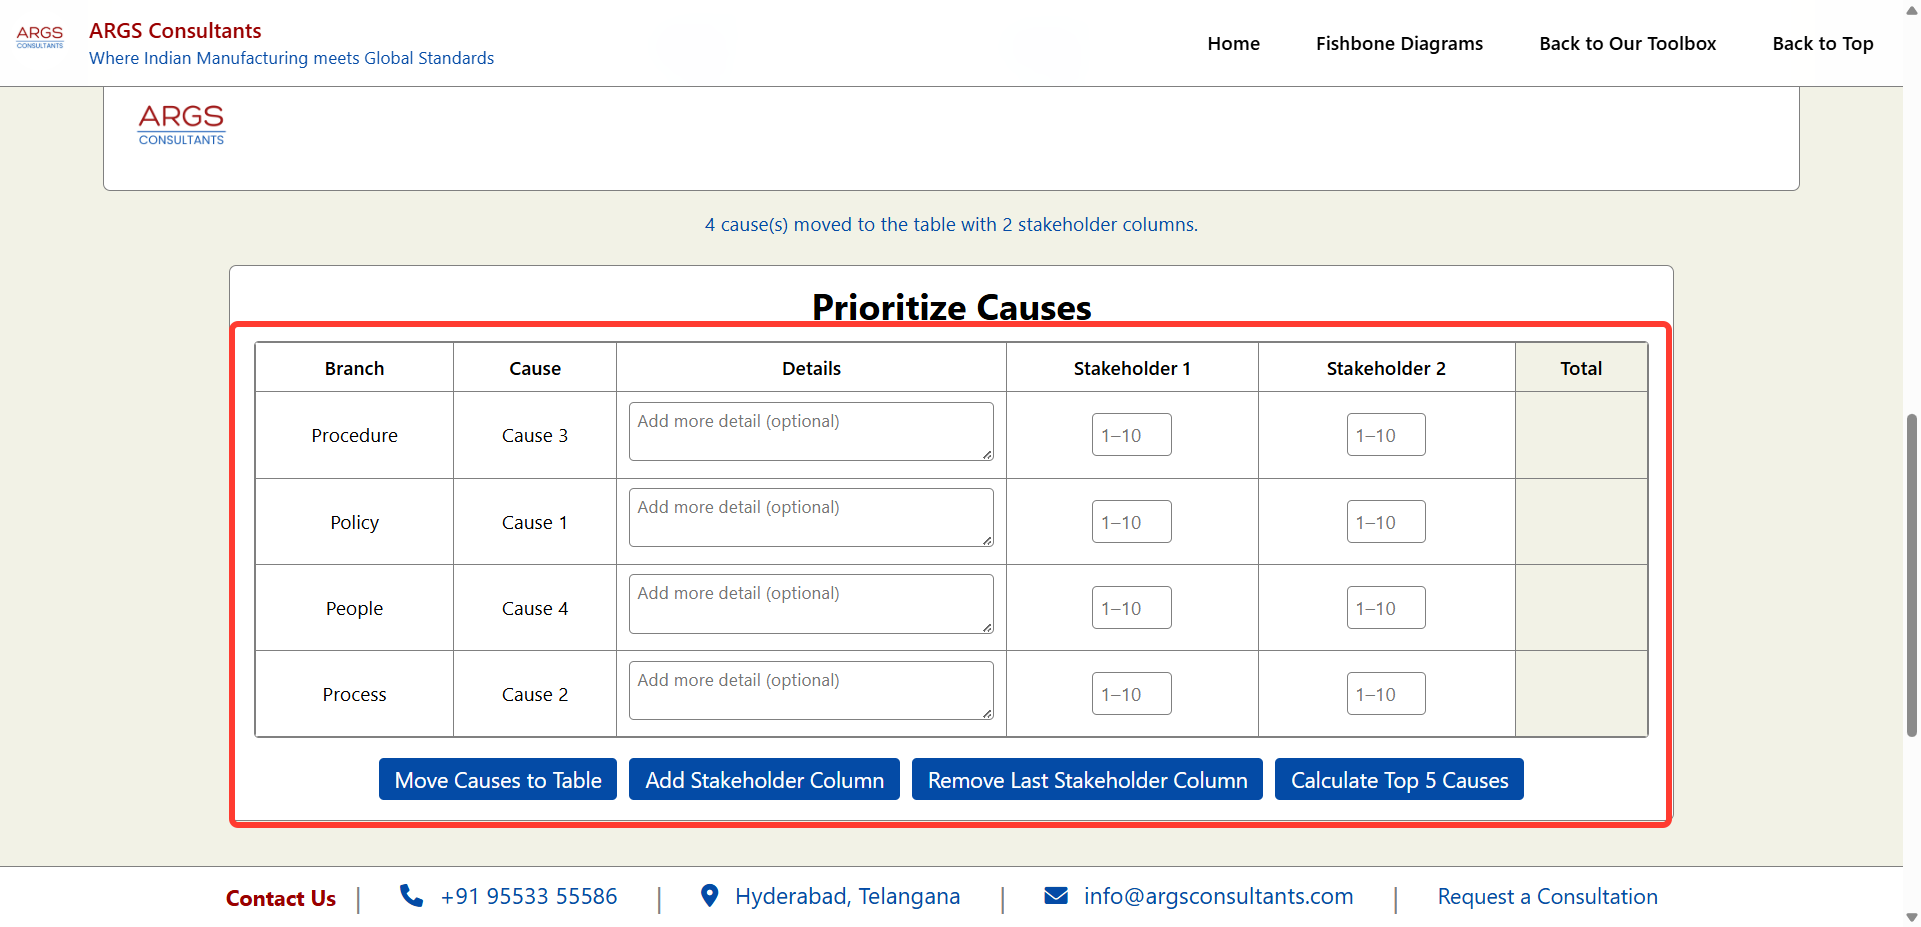
Other functions such as "Move Causes to Table" work in the same manner with reduced branches.